Bug #6296
closed
Interface dies with IPsec and SMP
0%
Description
When pushing a stream of UDP traffic over IPsec, an issue can be hit that leaves an interface dead chewing 100% of one CPU core looking something like the following.
12 root -92 - 0K 688K CPU1 1 14:37 100.00% intr{irq258: igb0:que}
or for re:
12 root -92 - 0K 272K CPU1 1 0:10 99.46% intr{irq261: re2}
em:
0 root -92 - 0K 320K CPU2 2 12:25 100.00% kernel{em1 taskq}
It's not NIC-specific, happens on at least em, igb, and re. Both 32 and 64 bit. It's been confirmed to stop happening if SMP is no longer in play - reduce a VM to one vCPU, or set hint.lapic.X.disabled for all but one core. It never happens on single core physical hardware.
With e1000 NICs, it often logs "watchdog timeout" on that NIC over and over once it gets into that state, but not always. Other NIC types I haven't seen any logs from.
The NIC that ends up dying is the LAN NIC, where the UDP traffic is being initiated. Everything on that NIC stops working. Output traffic stops about a minute or so after input traffic. Whether or not the NIC is completely dead seems to vary. On em and re, it seems to always be completely dead. On igb, there are serious connectivity issues, but it's not completely dead initially at least. Seems like it probably affects only one of the multiple queues in the igb case. Most of the time, it doesn't impact any other NICs on the system.
When it's in that state, tcpdump on the affected NIC shows no inbound traffic, though a span of the switch port shows traffic is being sent to the system. In the igb case, where it's not completely dead but has issues, tcpdump shows some but not all inbound traffic the switch is sending to its port.
It doesn't happen on stock FreeBSD RELENG_10_3 source, nor that plus tryforward. So the issue is somewhere in our changes, but outside of tryforward.
Discussed on these threads, possibly among others.
https://forum.pfsense.org/index.php?topic=110320.0
https://forum.pfsense.org/index.php?topic=110710.0
https://forum.pfsense.org/index.php?topic=110953.0
https://forum.pfsense.org/index.php?topic=110716.0
https://forum.pfsense.org/index.php?topic=110994.0
https://forum.pfsense.org/index.php?topic=110525.0
Files
 Updated by Greg M almost 8 years ago
Well well well :)
https://forum.pfsense.org/index.php?topic=107471.msg602590#msg602590
See last message: https://forum.pfsense.org/index.php?topic=107471.msg603180#msg603180 it helped me since then.
 Updated by Sam Bingner almost 8 years ago
This has been happening to me, the OUTBOUND traffic on the LAN interface continues to work but the driver or something is stuck and no data is ever read off the NIC. This was especially bad becuase it would always be the CARP master that died, and the CARP advertisments had no problem going out to the secondary thereby blocking CARP failover. I couldn't figure out how to troubleshoot it and just went back to 2.2 but it's happened on another 2.3 instance today. vmxnet3 does the same but it goes into 100% interrupt wait. I verified this on ESX where no data was ever handed off to the driver on both host and VM counters. I gave up primarily because I can't figure out how to duplicate it in a timely fashion. I'd like to help fix this if there is anything that would be helpful... ie debug on the VM etc - if there is some way to duplicate it now?
 Updated by Ludovic Pouzenc almost 8 years ago
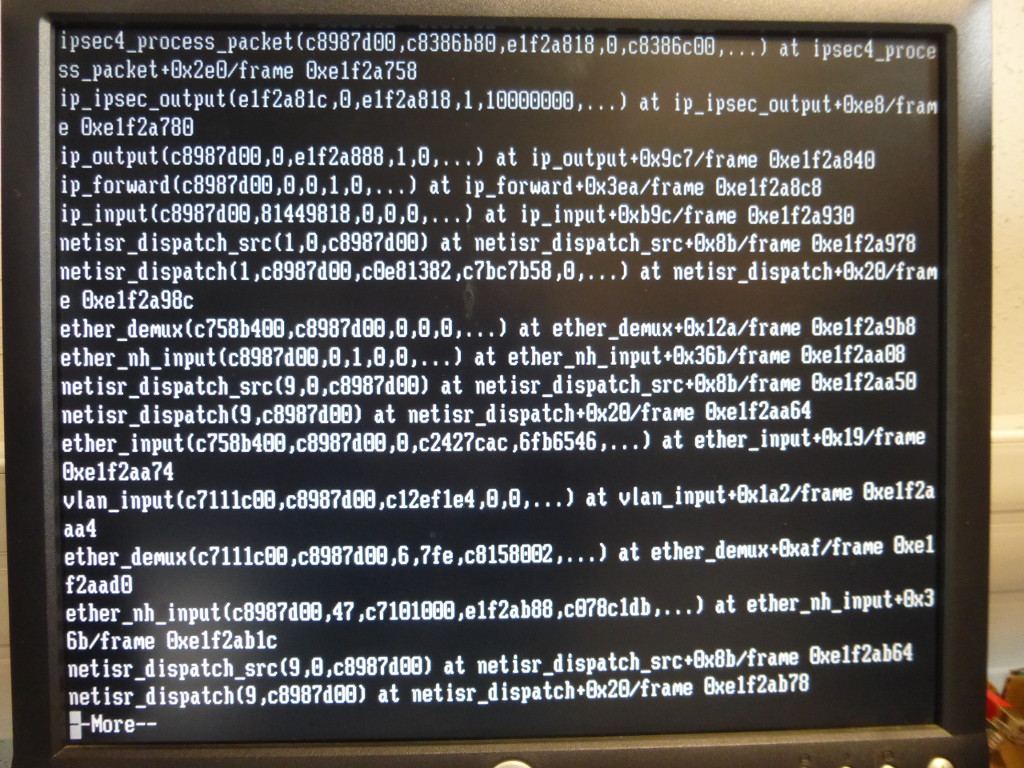
- File P1020397.JPG P1020397.JPG added
Hi,
I hit also the troubles. 100% kern, I ran ddb by hand disabling ddb.conf scripts to make a minidump and to try to understand. I am not used to trace anything in FreeBSD but in my understanding, there is a livelock right after ipsec4_process_packet+0x2e0.
I have a machine currently in this state, I will leave it this week-end (because I have a secondary pfSense that roughly do the job) and do some debug live monday if anyone is capable to drive me to check / dump / see the right things. My mail address as seen in my profile on this red mine is also an XMPP chat identifier, just add me and/or send an email.
I could send the minidump somewhere also. May I have to blurry some secrets in it, may have IPSEC keys in it I think.
Thanks for the great work guys. Shit happens, hoping help to resolve this one.
Ludovic
 Updated by Chris Buechler almost 8 years ago
- Status changed from Confirmed to Feedback
latest available snapshot has the fix merged. Test environments running now to verify.
Updated by Chris Buechler almost 8 years ago
my test setups are past 4 hours run time now, in a scenario where they never exceeded 4 hours before the fix.
One user who could easily replicate in minutes every time has confirmed it's no longer happening for him either.
needs more run time, but initial results look promising.
Updated by Chris Buechler almost 8 years ago
all still running fine after around 11 hours. That's more than 7 hours longer than any affected kernel has lasted in my current stress test.
Updated by Chris Buechler almost 8 years ago
- Status changed from Feedback to Resolved
This has lasted over 3 days now in multiple scenarios that wouldn't last 4 hours on affected kernels. Multiple outside reports from people who could more frequently replicate than most that it's also fixed for them.
 Updated by Brent Kerlin almost 8 years ago
Chris Buechler wrote:
This has lasted over 3 days now in multiple scenarios that wouldn't last 4 hours on affected kernels. Multiple outside reports from people who could more frequently replicate than most that it's also fixed for them.
Is there a schedule for this patch to be released or do I have to switch to the developer snapshot cycle?
 Updated by jeroen van breedam almost 8 years ago
Brent Kerlin wrote:
Chris Buechler wrote:
This has lasted over 3 days now in multiple scenarios that wouldn't last 4 hours on affected kernels. Multiple outside reports from people who could more frequently replicate than most that it's also fixed for them.
Is there a schedule for this patch to be released or do I have to switch to the developer snapshot cycle?
Its in the dev snapshots & it'll be in 2.3.1, which will be released soon (somewhere the next couple of days if nothing goes wrong)
 Updated by Jan-Peter Koopmann almost 8 years ago
Thanks guys!
For the official boxes (ADI image) there is no 2.3.1 development branch that we could upgrade to correct? So until 2.3.1 is released either live with the problem or disable the additional cores?
Regards,
JP
Updated by Sam Bingner almost 8 years ago
This just happened to me again on 2.3.1 - I've left the system in the locked up state in case you want (or want me) to check anything on it.
 Updated by Gary Smith over 7 years ago
I am seeing issued similar or the same as posted in this thread with 2.3.2 (2.3.1 was a typo), SMP, and IPsec. CPU randomly hits 100%. When I disable SMP the problem goes away. How do we re-open this case?
Version: 2.3.2-RELEASE (amd64)
built on Tue Jul 19 12:44:43 CDT 2016
FreeBSD 10.3-RELEASE-p5
CPU Type: Intel(R) Atom(TM) CPU D2550 @ 1.86GHz
Load average: 2.60, 2.25, 2.03
CPU usage: 86%
Memory usage: 6% of 4050 MiB
 Updated by Jim Pingle over 7 years ago
Not enough info there. Try again on 2.3.2, post on the forum, try to narrow it down. Unlikely to be the same bug, but there is a small chance it may be related.