Bug #8130
open
Status - Monitoring - Area chart displays traffic data differently than Line or Bar charts
0%
Description
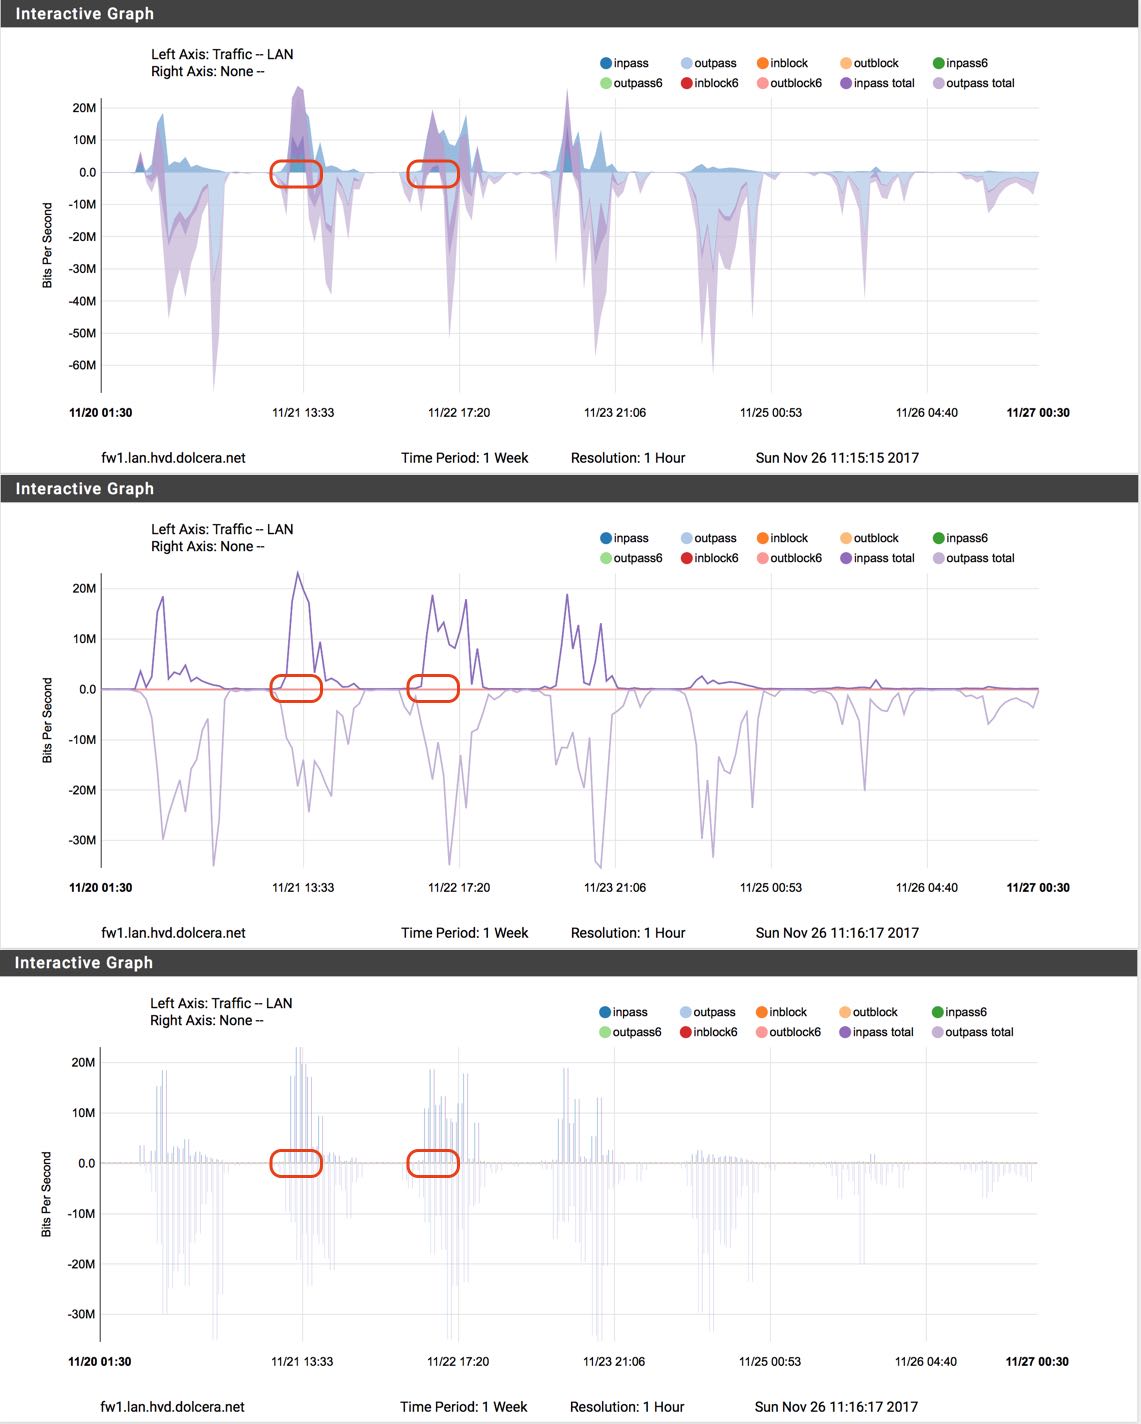
When setting a traffic chart to Area, portions of the chart where +Y (inpass) values are relatively high show 0 value for -Y (outpass) even though that's not correct compared to viewing the same chart using line or bar chart display.
Attaching comparison image showing the problem. I've circled a couple of the chart areas where the problem is visible.
Another issue with the area chart (maybe I need to file a separate bug?) is the inpass and outpass totals show as being double the value of inpass and outpass.
And also, the outpass total values on the area chart are shown as double the values in the line and bar chart (area chart shows peaks of outpass around 60M, line and bar charts show peaks as 30M).
I think I've seen the problem in 2.3 also, not certain.
Have not tested area v. line v. bar for CPU or other types of data. Just traffic.
Maybe I don't know how to read the area chart properly. Entirely possible. :)
Files
No data to display