Bug #15196
open
AWS ena interfaces can become unstable/stop responding
0%
Description
On AMD Epyc hardware in AWS, pfSense Plus ena interfaces can lose their IP addressing and then stop responding entirely.
The following log messages are present when this occurs:
Jan 16 18:34:35 np-aws-001 kernel: ena0: <ENA adapter> mem 0x80404000-0x80407fff at device 5.0 on pci0
Jan 16 18:34:35 np-aws-001 kernel: ena0: Elastic Network Adapter (ENA)ena v2.6.2
Jan 16 18:34:35 np-aws-001 kernel: ena0: Unable to allocate LLQ bar resource. LLQ mode won't be used.
Jan 16 18:34:35 np-aws-001 kernel: ena0: ena_com_validate_version() [TID:100000]: ENA device version: 0.10
Jan 16 18:34:35 np-aws-001 kernel: ena0: ena_com_validate_version() [TID:100000]: ENA controller version: 0.0.1 implementation version 1
Jan 16 18:34:35 np-aws-001 kernel: ena0: LLQ is not supported. Fallback to host mode policy.
Jan 16 18:34:35 np-aws-001 kernel: ena0: Ethernet address: 06:ba:32:98:fd:07
Jan 16 18:34:35 np-aws-001 kernel: ena0: [nm] netmap attach
Jan 16 18:34:35 np-aws-001 kernel: ena0: netmap queues/slots: TX 2/1024, RX 2/1024
and
Jan 19 03:49:07 kernel ena0: Found a Tx that wasn't completed on time, qid 1, index 925. 180522704 usecs have passed since last cleanup. Missing Tx timeout value 5000 msecs.
Jan 19 03:49:07 kernel ena0: Found a Tx that wasn't completed on time, qid 1, index 924. 179482704 usecs have passed since last cleanup. Missing Tx timeout value 5000 msecs.
Jan 19 03:49:07 kernel ena0: Found a Tx that wasn't completed on time, qid 1, index 923. 178472704 usecs have passed since last cleanup. Missing Tx timeout value 5000 msecs.
Jan 19 03:48:54 kernel ena0: Found a Tx that wasn't completed on time, qid 1, index 922. 167002704 usecs have passed since last cleanup. Missing Tx timeout value 5000 msecs.
Files
 Updated by Craig Coonrad 4 months ago
- Status changed from New to Confirmed
Confirmed.
CPU: AMD EPYC 7571 (2199.98-MHz K8-class CPU)
ena0: Found a Tx that wasn't completed on time, qid 1, index 528. 67990000 usecs have passed since last cleanup. Missing Tx timeout value 5000 msecs.
Updated by Craig Coonrad 4 months ago
Closed/Fixed FreeBSD bug that appears similar.
Feb 5 20:58:51 awesomehost kernel: ena0: Found a Tx that wasn't completed on time, qid 0, index 0.
 Updated by Jim Thompson 3 months ago
Hmmm 9272e45 committed Dec 28, 2023
ena: Change measurement unit of time since last tx cleanup to ms
This commit:
1. Sets the time since last cleanup to milliseconds.
2. Fixes incorrect indentations.
Approved by: cperciva (mentor)
MFC after: 2 weeks
Sponsored by: Amazon, Inc.
@ if (unlikely(time_offset > adapter->missing_tx_timeout)) {
if (tx_buf->print_once) {
- time_since_last_cleanup = TICKS_2_USEC(ticks
+ time_since_last_cleanup = TICKS_2_MSEC(ticks -
tx_ring
missing_tx_comp_to = sbttoms(
adapter->missing_tx_timeout);
ena_log(pdev, WARN,
"Found a Tx that wasn't completed on time, qid %d, index %d. "
- "%d usecs have passed since last cleanup. Missing Tx timeout value %d msecs.\n",
+ "%d msecs have passed since last cleanup. Missing Tx timeout value %d msecs.\n",
tx_ring->qid, i, time_since_last_cleanup,
missing_tx_comp_to);
}
@
 Updated by Kristof Provost 3 months ago
Freeback from Amazon:
Hey,
This is a bit of a dija-vu, I've seen something like this before on ARM platforms where all the IRQs were handled on CPU 0.
Since CPU 0 would be at 100% usage at that time then it would keep postponing the cleanup task eventually causing this error.
We added an option for the driver users to manually spread IRQs over CPUs to ease the pressure on CPU0 (or any other CPU)
I recall this issue happened most with UDP traffic as well since it consumed lots of CPU usage.
Can you please gather more information about CPU usages and system loads around the time of this issue?
Best regards,
Osama
So: do we know anything about the load on affected systems?
Colin also wondered if we've seen this on earlier versions (i.e. 23.05.1 or earlier), and if we've ever seen the warning without associated loss of connectivity.
 Updated by Roberto@ IT and General 3 months ago
Greetings everyone,
I'm Roberto, from IT Ad General.
I'd like to provide some additional details to help better understand and resolve the issue we're encountering with the pfSense instance on AWS.
The problem described in this ticket was also encountered after we redeployed the pfSense instance using an Intel(R) Xeon(R) Platinum 8259CL CPU @ 2.50GHz (2500.00-MHz K8-class CPU) CPU. Therefore, we are facing identical issues using a different CPU architecture.
Another notable difference we observed is in the configuration:
1. The BIOS Vendor related to our old pfSense testing appliance on AWS is Xen and the network card type assigned to the interfaces is xn . This instance works smoothly
2. The instance facing the issue is running with a BIOS Vendor Amazon EC and network cards type assigned is eni
Hope that would help
Roberto
Updated by Craig Coonrad 3 months ago
- File image004-1.png image004-1.png added
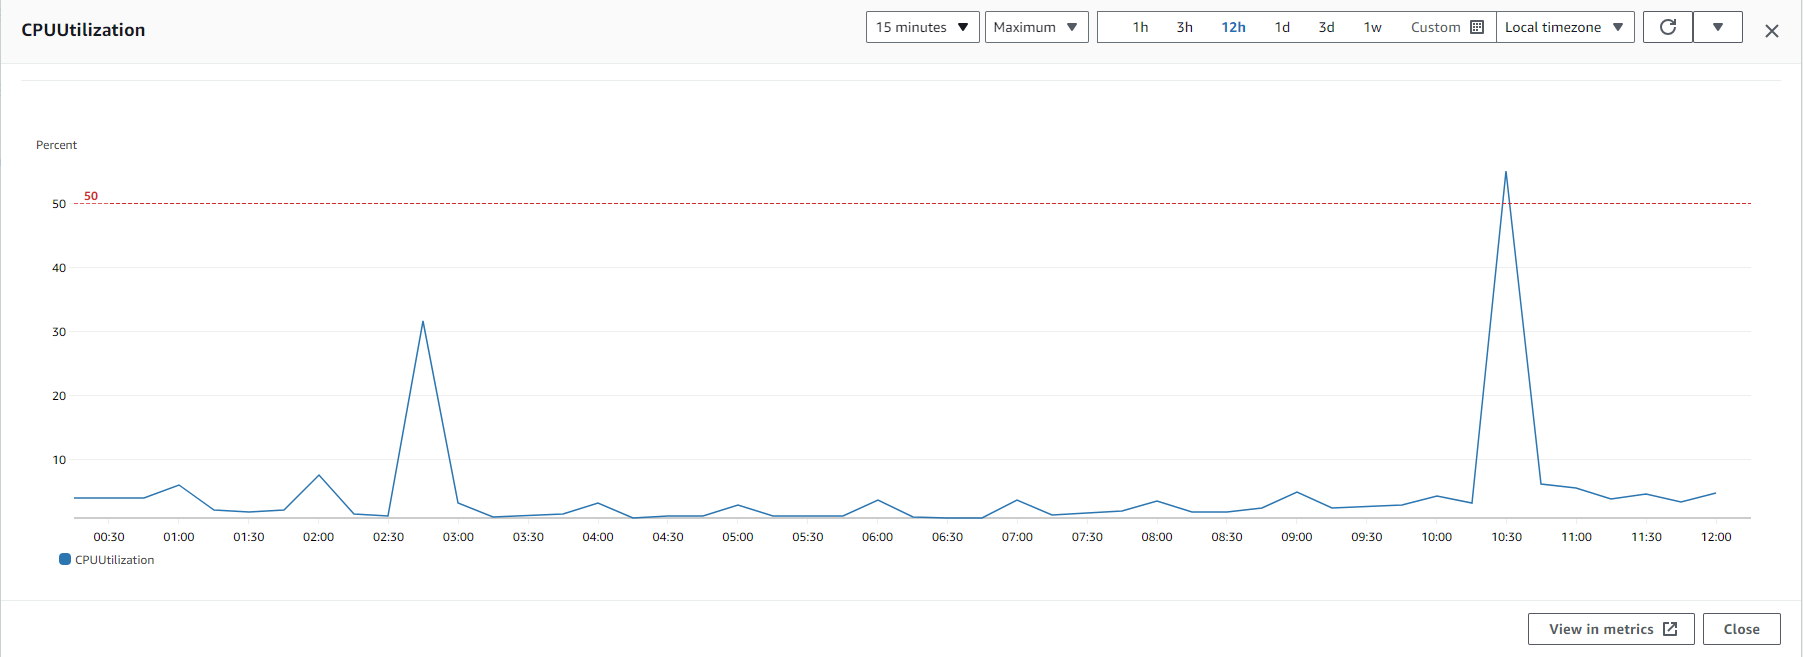
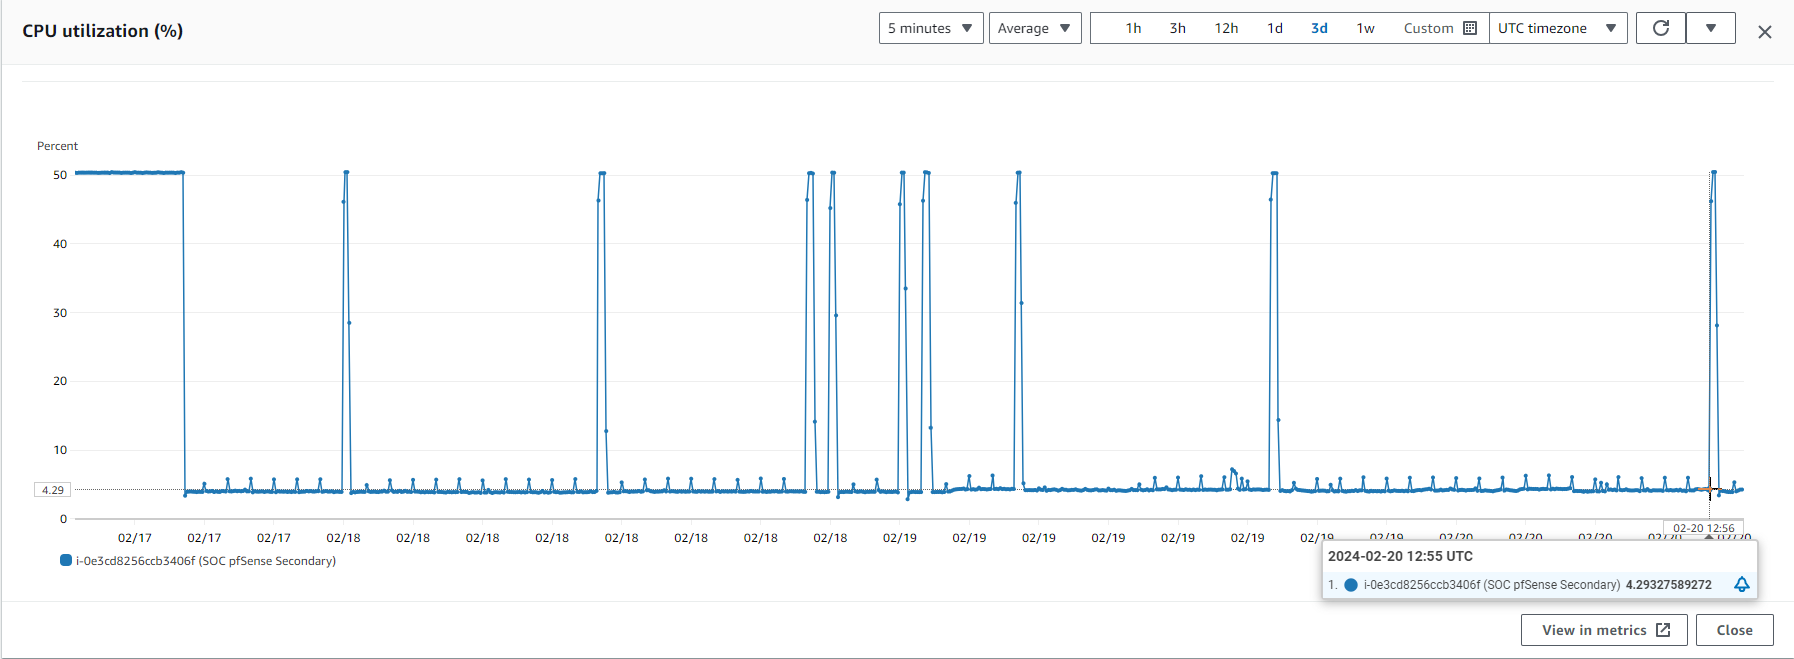
User is reporting this issue manifests in relation to CPU spikes.
Also I want to point that I have a procedure to restart the pfSense if is on 45-50 % CPU usage more then 20 min and that is because we so if it is goes an that CPU is became unresponsive. Here, I would like to display the CPU usage graph, and what's peculiar is that the CPU usage for all spikes begins 5 minutes prior to the top of the hour.
 Updated by Kris Phillips 2 months ago
Tecsys is requesting an update on this bug report.
 Updated by Lev Prokofev about 1 month ago
Another client hit this issue ticket #2598286486
 Updated by Georgiy Tyutyunnik 8 days ago
another ticket with this issue
#2694269097
Updated by Kris Phillips 8 days ago
Another customer in ticket 2706080899 with this issue.
Updated by Kristof Provost 1 day ago
There's still very little to go on here.
Let's start by seeing if we can identify what's causing the high CPU load. The initial assumption would be that this is something in the ena driver, so please run this dtrace script on the next affected machine:
#!/usr/sbin/dtrace -s

fbt:if_ena::
{

}

profile:::tick-1sec
{
    printf("timeout\n");
    exit(0);
}

dtrace:::END
{
    printf("Done tracing\n");
}
That will automatically end after 1 second, and should give us a list of ena functions being called. Hopefully that will give us an idea of where to concentrate for further investigation.
Additionally, are any of the affected machines running 24.03, or are they all 23.09.01?
 Updated by Chris W about 24 hours ago
HS# 2718685720 is a 24.03 guest which was upgraded from 23.09.1. Only when on 24.03 did the problem begin, however.
Updated by Georgiy Tyutyunnik about 4 hours ago
new case #2733381806
client will run the script when able to