Bug #4937
closed
RRD graphs with mixed quantities are unreadable
0%
Description
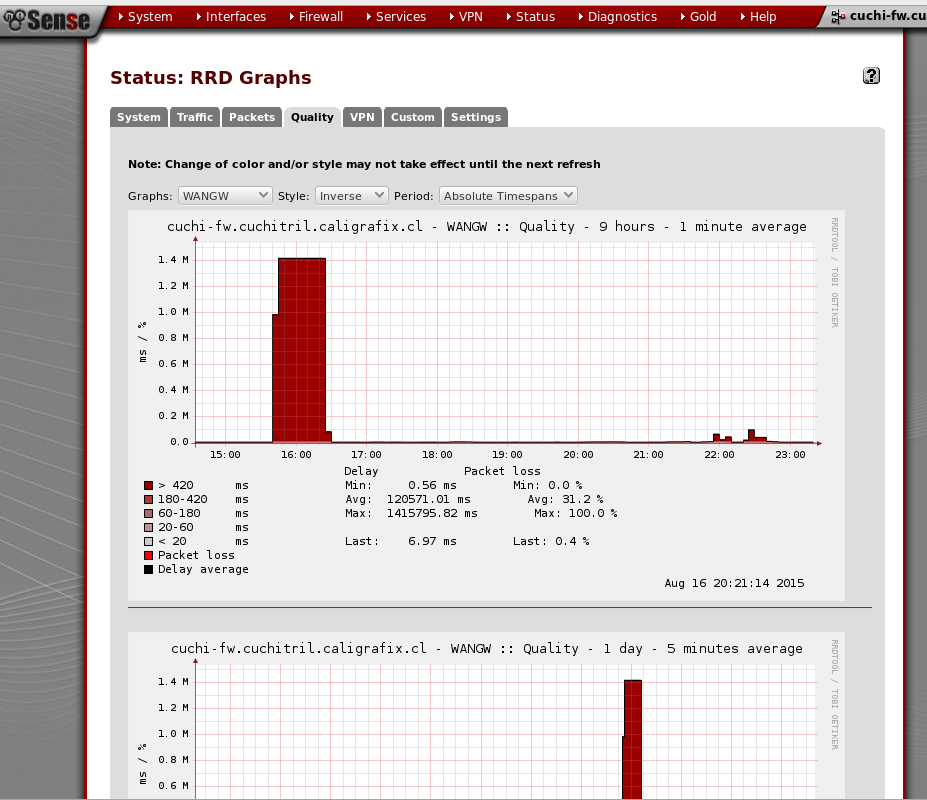
Some RRD graphs plot data that have incompatible units in the same canvas. For instance, the Quality graph shows both latency and packet loss. Packet loss is in the 0-100 range, but latency can go orders of magnitude higher than 100 (attached screenshot shows latency values in the 1.5 MEGA range). When this occurs, the packet loss information is not readable. Moreover, a single big spike in latency makes all the historical graphs unreadable.
The same happens, though to a lesser extent in my experience, with the Processor graph (see Feature #4664)
One solution, if the plotting library allows it, would be to have two scales in the graphs (for instance one on the left and one on the right).
If this is not possible, then it would be desirable to provide separate graphs.
Files
 Updated by Chris Buechler over 9 years ago
- Status changed from New to Closed
- Affected Version deleted (
2.2.4)
fixed in monitoring graphs in 2.3
 Updated by Guillaume Pothier over 9 years ago
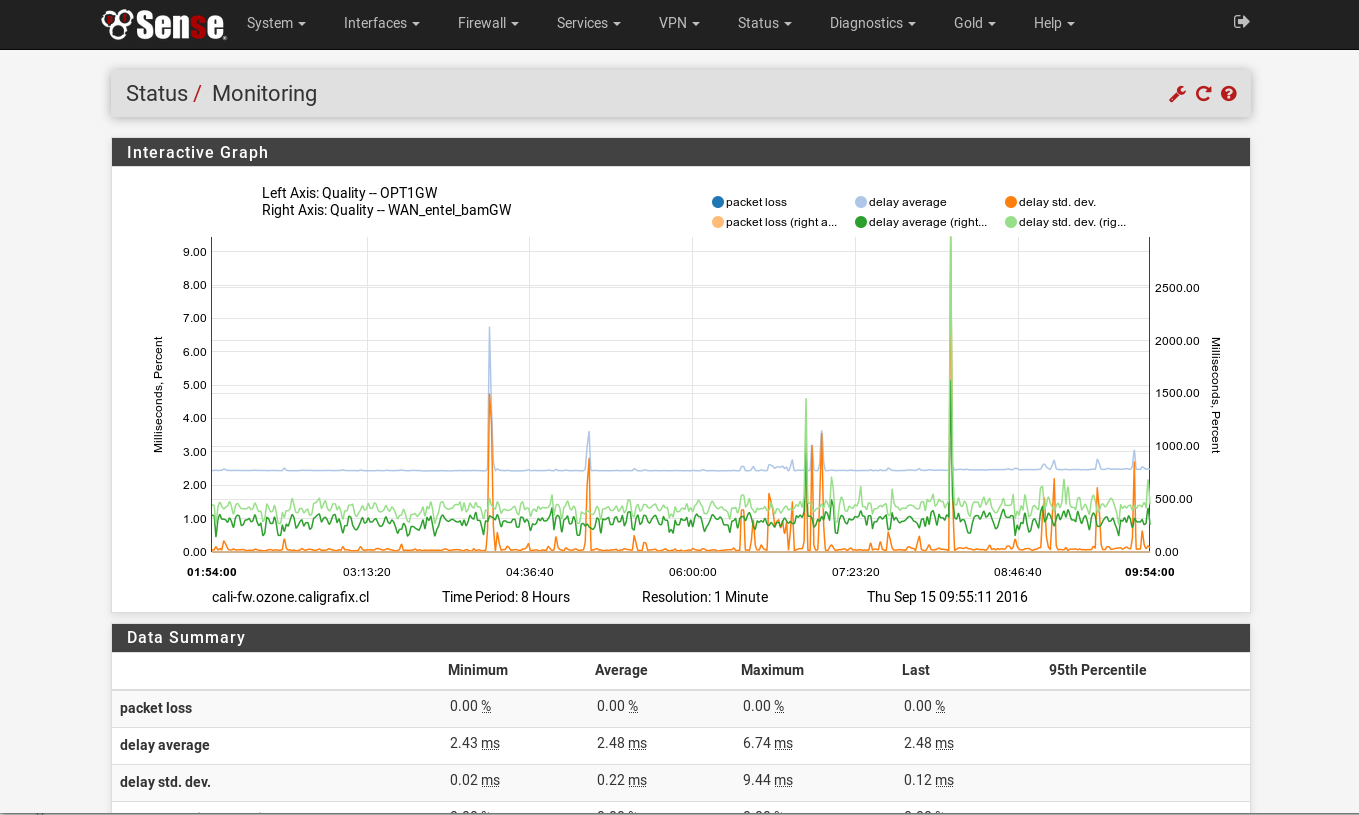
Hi, the issue is exactly the same on 2.3. Packet loss and latency still share the same scale, so one can definitely dwarf the other (see attached screenshot). Also, in 2.3 it is now possible to have two gateways on the same graph, with scales on both sides of the graph. but in this case, in addition to the previous problem, the graph shows latencies on two different scales, and percentages on two different scales, which makes comparison impossible. In the attached screenshot, I monitor my two gateways: one is a fiber link, and the other one is a backup mobile broadband link, with two completely disparate latency scales.
In this case it would be much better to have all the time unit on one side, and all the percentage unit on the other side.