Bug #12119
closed
[dashboard] WAN traffic graph displays no data when suricata is enabled
0%
Files
 Updated by Erik Schaeffer over 4 years ago
- File 2021-07-09_20-49-51.png 2021-07-09_20-49-51.png added
- File 2021-07-09_20-52-00.png 2021-07-09_20-52-00.png added
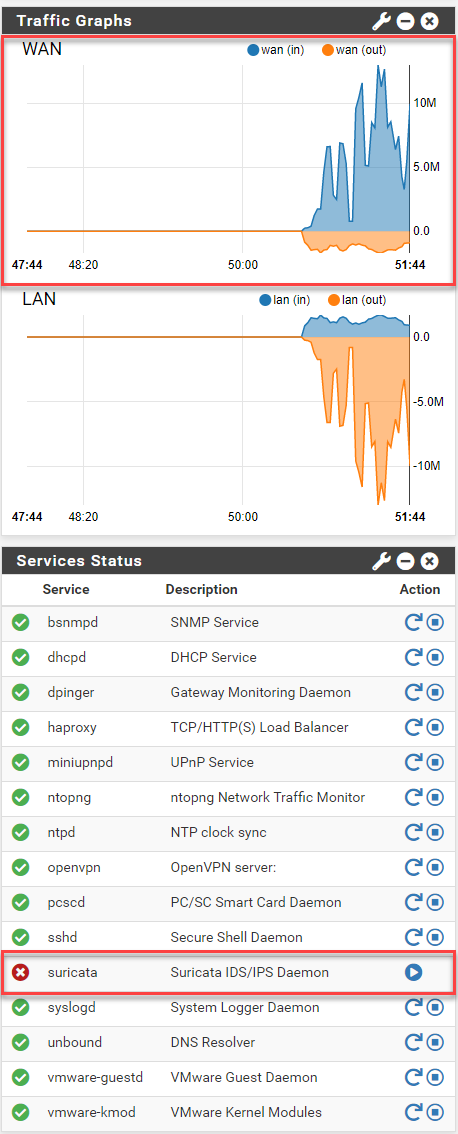
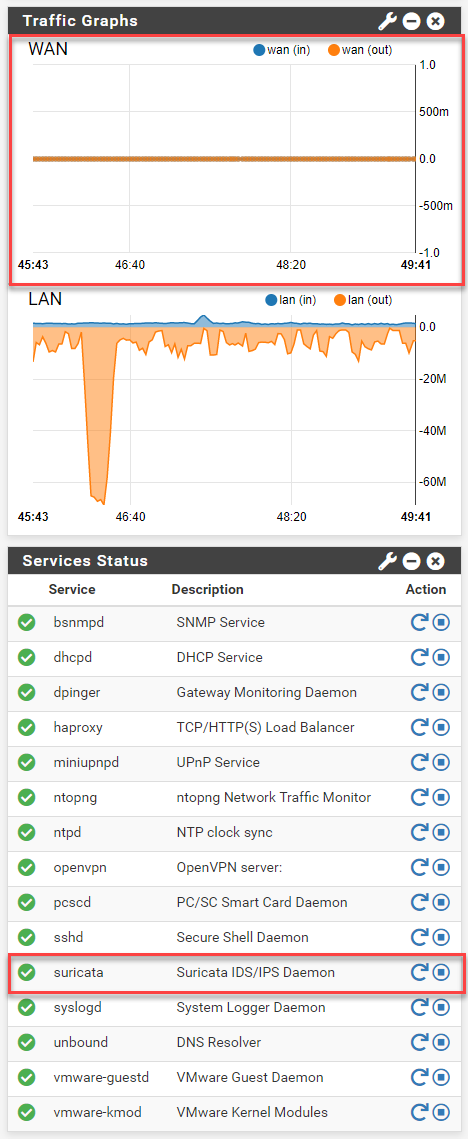
Attaching screenshots of the issue.
 Updated by Max Leighton over 4 years ago
I'm not able to reproduce this with Suricata 6.0.0_11 in pfSense 2.5.2 or 2.6. I tried with blocking mode enabled and disabled on WAN and my Traffic Graphs widget continues to show graph data. More details on how to reproduce will be needed I think.
Updated by Erik Schaeffer over 4 years ago
Certainly!
pfsense ver: 2.5.2
suricata ver: 6.0.0_11
Suricata Options Other than defaults:
- Block Offenders: Enabled
- IPS Mode: Inline
I saw this issue on both VMXNET3, e1000, and Intel Gig NICs. Let me know what else I can provide that would be helpful. Thank you!
Updated by Erik Schaeffer over 4 years ago
WAN Interface is a standard DHCP setup
 Updated by Jim Pingle over 4 years ago
- Status changed from New to Not a Bug
This is normal and expected when using inline mode and NETMAP. The interface behavior is fundamentally different in that mode and it does not keep statistics since they can degrade performance.