Bug #15877
closed
Web server crashes
0%
Description
I updated from 24.03 to 24.11.
The Portal crashes after a few minute & I need to ssh into the FW to restart the web server (Menu 16 : PHP + FPM)
At the very bottom, you can find the TOPs from the console.
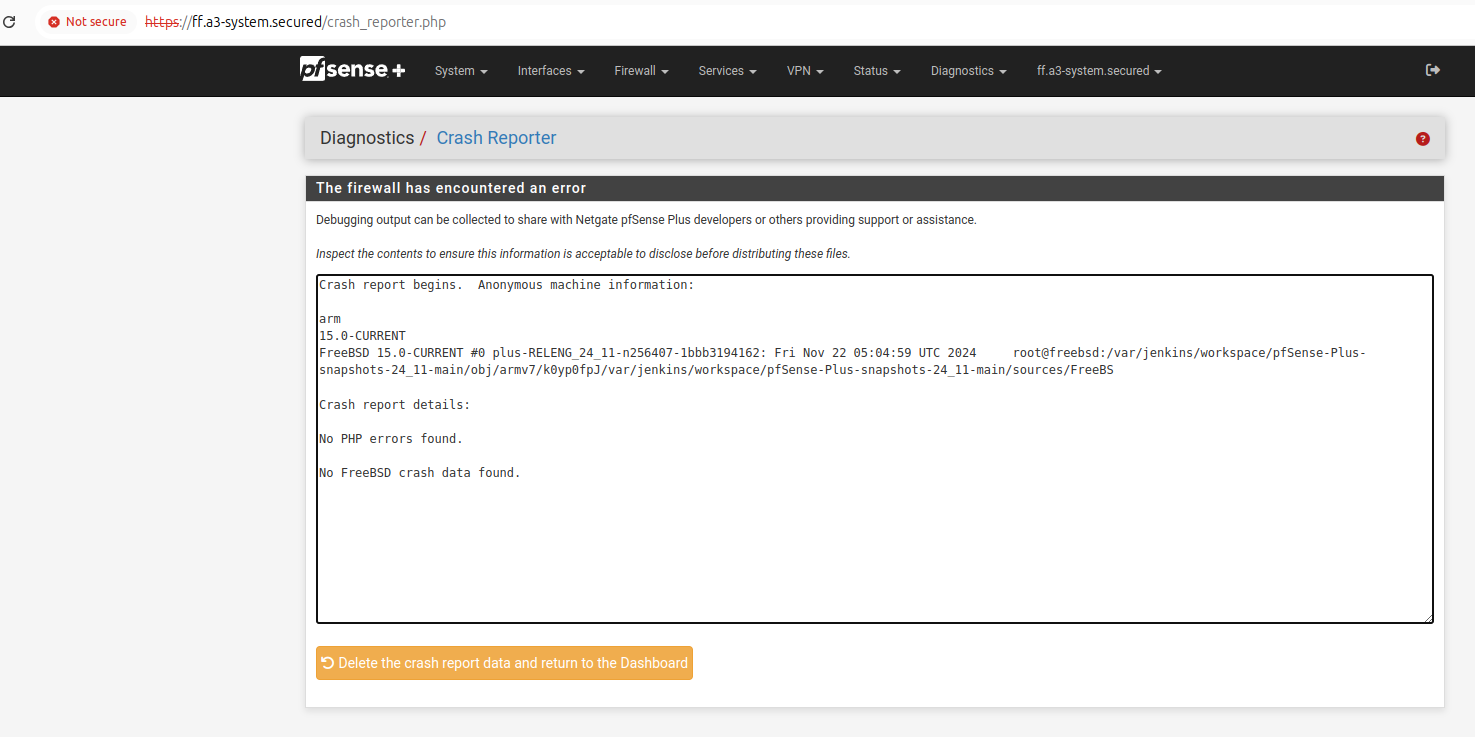
Crash report seems empty (see screen shot).
It seems there is a BZCAT that runs full throttle .
\T,
------------------------------- With a session open to the Portal -------------------------------
last pid: 65264; load averages: 8.58, 5.84, 4.82 up 0+00:43:37 11:40:51
84 processes: 9 running, 75 sleeping
CPU: 94.7% user, 0.0% nice, 5.3% system, 0.0% interrupt, 0.0% idle
Mem: 167M Active, 81M Inact, 174M Wired, 84M Buf, 1565M Free
PID USERNAME    THR PRI NICE   SIZE    RES STATE    C   TIME    WCPU COMMAND
53408 root          1  97    0  8344K  6040K RUN      0   0:03  57.42% bzcat
16142 root          1  99    0  8344K  6040K RUN      1   0:37  32.00% bzcat
27955 root          1  98    0  8344K  6040K CPU0     0   0:44  24.94% bzcat
32589 root          1  98    0  8344K  6040K RUN      0   0:48  24.71% bzcat
29717 root          1  99    0  8344K  6040K RUN      0   0:57  18.79% bzcat
14797 root          1  97    0  8344K  6040K RUN      0   0:52  13.17% bzcat
48968 root          1  98    0  8344K  6040K RUN      0   0:10   9.27% bzcat
53668 root          1  23    0  9296K  7004K piperd   1   0:00   4.25% tail
32672 root          1  20    0  9296K  7004K piperd   1   0:05   2.57% tail
16475 root          1  21    0  9296K  7004K piperd   1   0:04   2.32% tail
26803 root          1  99    0  8344K  6040K RUN      0   0:22   2.18% bzcat
29792 root          1  20    0  9296K  7004K piperd   0   0:05   2.09% tail
27958 root          1  20    0  9296K  7004K piperd   1   0:04   1.77% tail
14954 root          1  20    0  9296K  7004K piperd   0   0:05   1.43% tail
48986 root          1  21    0  9296K  7004K piperd   0   0:01   1.08% tail
40576 root          1  20    0  7044K  3668K CPU1     1   0:00   0.85% top
26903 root          1  21    0  9296K  7004K piperd   0   0:02   0.25% tail
64599 root          1  20    0    14M  9684K select   0   0:01   0.17% sshd
 5552 root          5  68    0  5600K  2572K uwait    1   0:01   0.06% dpinger
 4957 root          5  68    0  5600K  2572K uwait    1   0:01   0.05% dpinger
20822 root          1  68    0   125M    41M piperd   0   0:24   0.00% php-fpm
94717 root          1  68    0   125M    41M piperd   0   0:16   0.00% php-fpm
 4487 root          1  68    0   125M    41M piperd   1   0:14   0.00% php-fpm
99370 root          1  68    0   125M    42M piperd   1   0:12   0.00% php-fpm
43207 root          1  68    0   125M    41M piperd   1   0:11   0.00% php-fpm
18434 root          1  68    0   125M    41M piperd   0   0:08   0.00% php-fpm
15248 root          1  68    0   125M    41M piperd   0   0:08   0.00% php-fpm
18309 root          1  68    0   125M    41M piperd   0   0:07   0.00% php-fpm
20387 unbound       2  20    0    43M    34M kqread   0   0:05   0.00% unbound
82979 root          1  20    0    24M    10M kqread   0   0:02   0.00% nginx
53835 root          1  68   20  5368K  2584K wait     1   0:01   0.00% sh
97425 root          1  20    0  5360K  2960K kqread   1   0:01   0.00% syslogd
 4318 root          7  20    0    30M    19M select   1   0:01   0.00% kea-dhcp4
97863 root          1  20    0  4920K  2524K kqread   1   0:01   0.00% tail
18952 root          7  20    0    28M    19M select   1   0:01   0.00% kea-dhcp6
------------------------------- With NO session open to the Portal -------------------------------
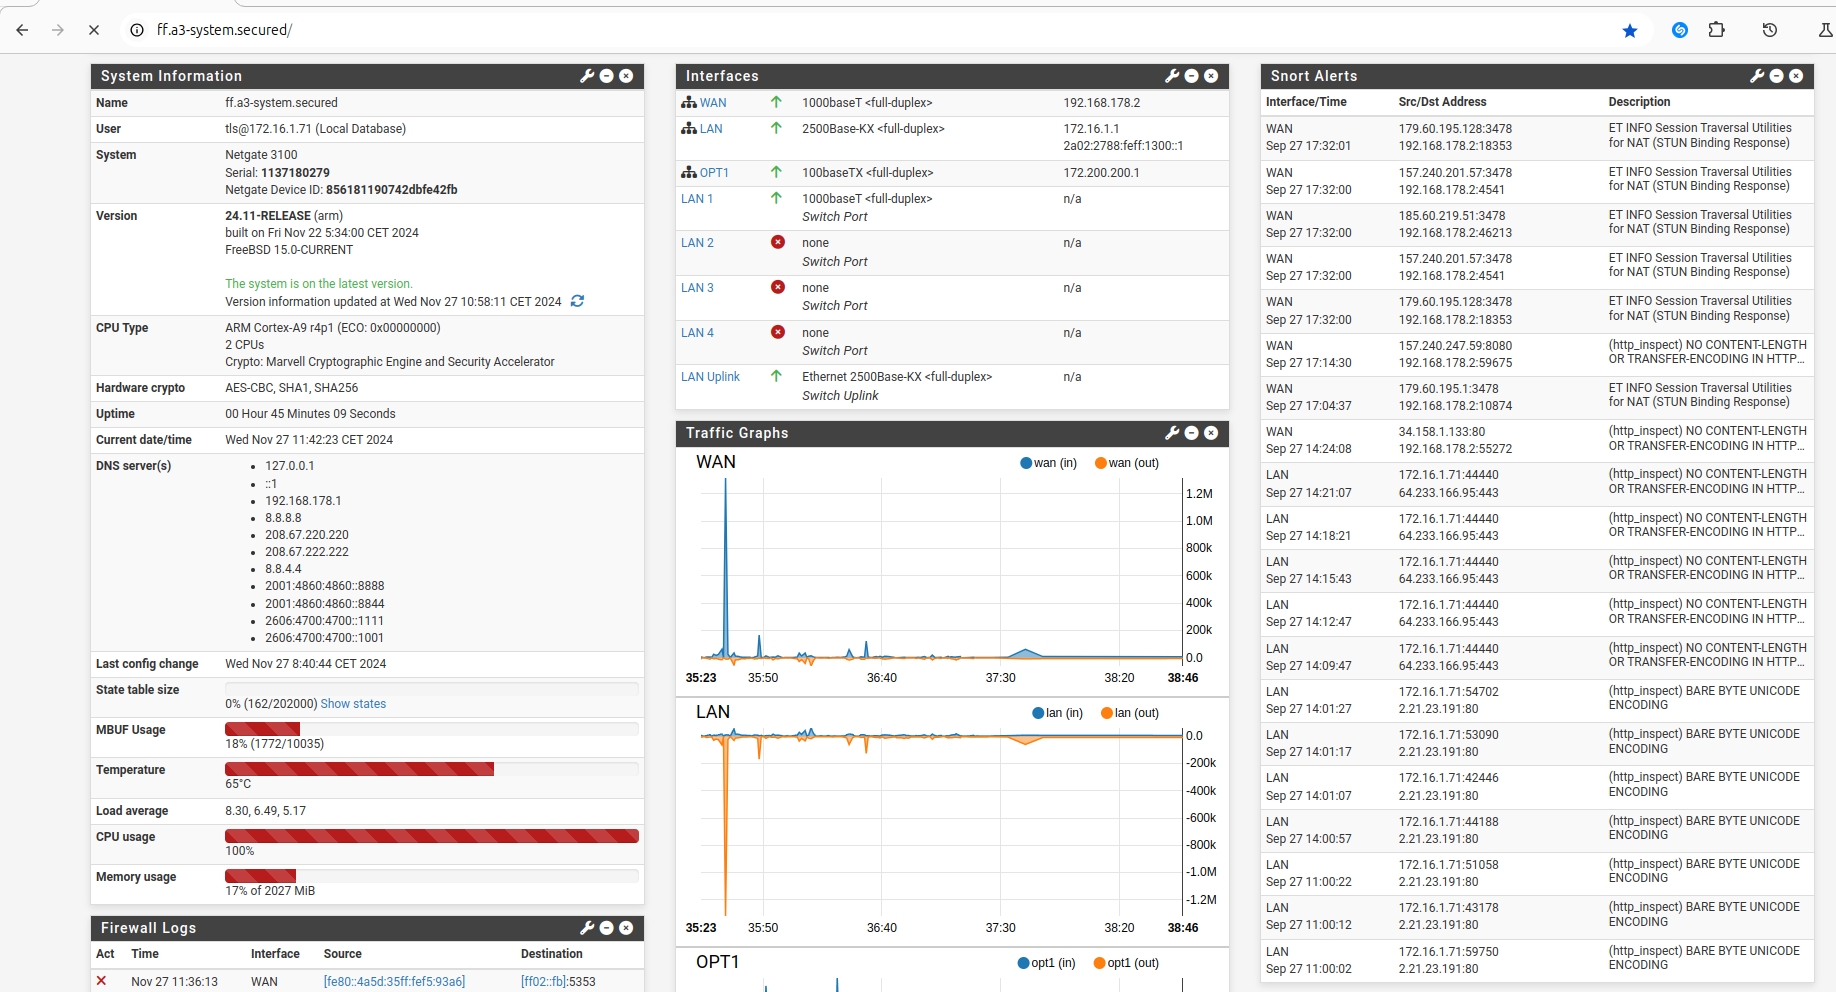
last pid: 79178; load averages: 2.01, 5.04, 5.21 up 0+00:51:48 11:49:02
58 processes: 2 running, 56 sleeping
CPU: 53.8% user, 0.0% nice, 2.3% system, 0.0% interrupt, 43.9% idle
Mem: 85M Active, 82M Inact, 171M Wired, 83M Buf, 1649M Free
PID USERNAME    THR PRI NICE   SIZE    RES STATE    C   TIME    WCPU COMMAND
27469 root          1 131    0  8344K  6040K CPU0     0   0:29  99.79% bzcat
27598 root          1  29    0  9296K  7004K piperd   0   0:03  11.53% tail
60409 root          1  20    0  6880K  3508K CPU1     1   0:00   0.44% top
64599 root          1  20    0    14M  9684K select   0   0:01   0.09% sshd
 5552 root          5  68    0  5600K  2572K uwait    1   0:01   0.03% dpinger
 4957 root          5  68    0  5600K  2572K uwait    1   0:01   0.02% dpinger
18952 root          7  20    0    28M    19M select   1   0:01   0.02% kea-dhcp6
56960 root          2  20    0    11M  7748K select   1   0:00   0.01% openvpn
 1283 root          1  20    0    94M    30M kqread   1   0:00   0.01% php-fpm
69010 root          1  20    0  5568K  3016K bpf      0   0:01   0.01% filterlog
20387 unbound       2  20    0    43M    34M kqread   1   0:06   0.00% unbound
 1454 root          1  68    0   128M    44M accept   1   0:04   0.00% php-fpm
 1580 root          1  68    0   126M    41M piperd   0   0:04   0.00% php-fpm
82979 root          1  20    0    24M    10M kqread   1   0:02   0.00% nginx
53835 root          1  68   20  5368K  2584K wait     1   0:02   0.00% sh
97425 root          1  20    0  5360K  2960K kqread   1   0:01   0.00% syslogd
 4318 root          7  20    0    30M    19M select   0   0:01   0.00% kea-dhcp4
97863 root          1  20    0  4920K  2524K kqread   0   0:01   0.00% tail
 1678 root          1  20    0  4856K  2476K select   0   0:01   0.00% tail
74762 root          1  20    0    12M  7096K select   1   0:00   0.00% ntpd
 5614 root          1  53    0    95M    39M accept   1   0:00   0.00% php-fpm
64499 root          1  20    0    12M  8376K select   1   0:00   0.00% openvpn
61335 root          2  20    0    13M  9320K select   1   0:00   0.00% openvpn
34701 root          1  20    0  5120K  2508K nanslp   1   0:00   0.00% cron
44611 root          1  68    0  6928K  3948K pause    0   0:00   0.00% tcsh
19262 root          1  20    0  5440K  2596K wait     0   0:00   0.00% sh
64127 root          1 -52   r0  4568K  4592K nanslp   1   0:00   0.00% watchdogd
10972 root          3  68    0    10M  3188K usem     1   0:00   0.00% filterdns
 1384 root          1  20    0  6328K  3408K select   1   0:00   0.00% devd
80649 root          1  68    0  5244K  2840K wait     0   0:00   0.00% login
85492 root          1  55    0  5720K  3088K wait     1   0:00   0.00% sh
98267 root          2  68    0  5672K  2820K piperd   1   0:00   0.00% sshg-blocker
95609 root          1  68    0  5440K  2948K ttyin    0   0:00   0.00% sh
27150 root          1  68    0  5340K  2932K wait     0   0:00   0.00% sh
98020 root          1  20    0    11M  4472K piperd   1   0:00   0.00% sshg-parser
[24.11-RELEASE][admin@ff.a3-system.secured]/root:
Files
 Updated by
  Updated by
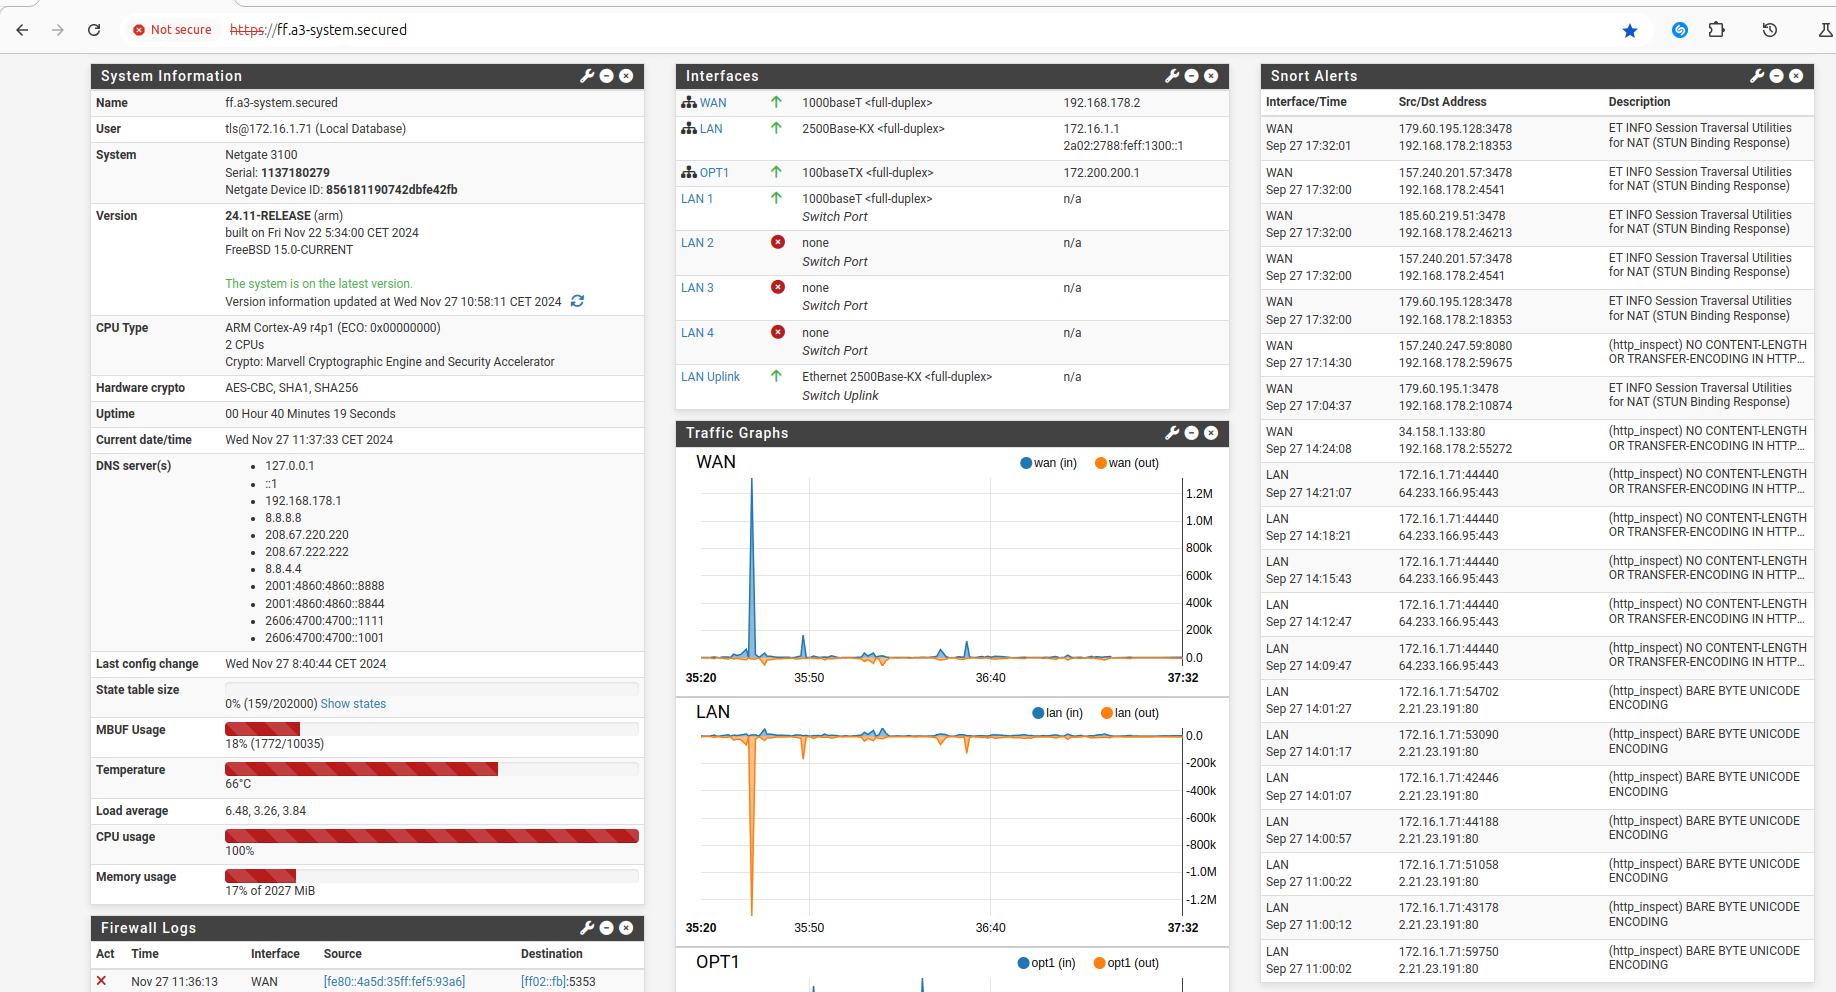