Bug #10959
open
Traffic graph stopped on interface used via netmap
0%
Description
Current Base System: 2.5.0.a.20201005.1047
Problem: After update, the traffic grafic stoped on interface with snort configured in mode "inline IPS". IF disable snort or alter snort to "legacy mode" the traffic grafic on interface work normaly
Files
 Updated by Teste Teste almost 6 years ago
Current Base System: 2.5.0.a.20201005.1047
Problem: After update, the traffic graphic stopped on interface with snort configured in mode "inline IPS". IF disable snort or alter snort to "legacy mode" the traffic graphic on interface work normally
 Updated by Jim Pingle almost 6 years ago
- Subject changed from traffic grafic stoped on interface with snort mode inline IPS to Traffic graph stopped on interface used via netmap
- Category set to Traffic Graphs
- Status changed from New to Feedback
- Affected Version set to 2.5.0
Which traffic graphs specifically?
The ones on the dashboard?
The one on Status > Traffic Graph?
The ones under System > Monitoring?
What snapshot did you upgrade from?
And what type of network interface do you have?
It's likely from the interface being used in netmap mode, so there may not be much that can be done to work around it. The way the driver supports netmap may have changed in a way that made the traffic graphs not be able to poll data.
Updated by Teste Teste almost 6 years ago
In the dashboard and Status > Traffic Graph
Updated by Teste Teste almost 6 years ago
I've been using pfsense 2.5 for a month now, worked normally. only after 2020-10-02 updates the traffic graphic stopped
 Updated by Bill Meeks almost 6 years ago
Edivan Carneiro de castro wrote:
I've been using pfsense 2.5 for a month now, worked normally. only after 2020-10-02 updates the traffic graphic stopped
Do you mean you were previously using Snort on pfSense-2.5 with Inline IPS Mode enabled? Or were you using Legacy Mode and switched to Inline IPS Mode after the last Snort package update?
One thing that changed in the latest Snort package update was a new version of the DAQ library was added (version 2.2.2_2). This new DAQ update implements the very latest netmap API 14 used in FreeBSD-12/STABLE. Also, FreeBSD-12 implements netmap functionality as part of the iflib framework. I believe continual "tweaking" is going on there with repect to various NIC drivers and even the netmap device itself.
So the first critical data point for troubleshooting is to determine if you were successfully using Inline IPS Mode with Snort on pfSense-2.5 prior to October 2nd (and also successfully using Traffic Graph). In the past, those two elements (netmap operation with Inline IPS Mode and Traffic Graph) have not been compatible.
 Updated by Scott Morrison over 5 years ago
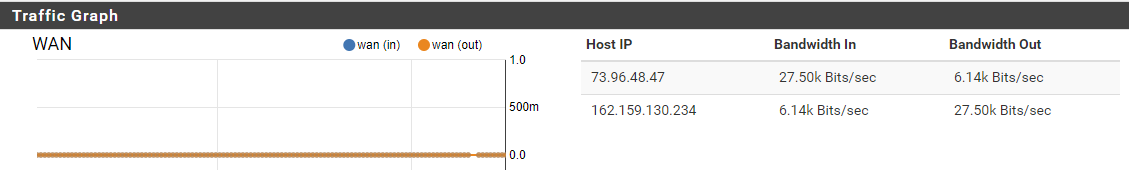
- File Capture.PNG Capture.PNG added
Can confirm this same behavior exists with Suricata with netmap enabled as well.
However, it appears to be an issue with the graphs, not the data. Dashboard shows all graphs points on the line at zero. Graph in Status | Traffic Graph shows all zeros, but does show valid entries: