Bug #11173
closed
Status>Monitoring parameters are hidden by the interactive graph
0%
Description
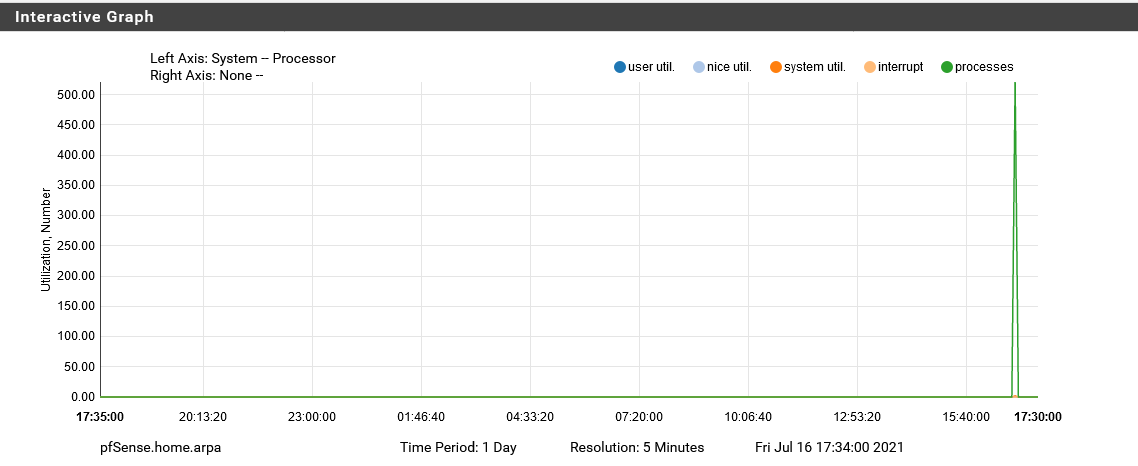
There is text underneath the graph in Status>Monitoring which should show the system name, time period, resolution, and current date that have been chosen in the settings. The text is barely visible because it is cut off by the end of the element.
Files
 Updated by Jim Pingle over 5 years ago
- Project changed from pfSense to pfSense Packages
- Category changed from Web Interface to Status_Monitoring
- Assignee set to Jared Dillard
- Affected Version changed from 2.5.0 to All
Not a new problem, it's been like that for a while. Though I don't see an existing entry for it.
 Updated by Marcos M about 5 years ago
Looks like it's due to the height property on `.svg.nvd3-svg`. Though some extra styling needs to be done to make it work well in different resolutions. Tested the same on Chromium and Firefox.
Updated by Marcos M about 5 years ago
- Assignee changed from Jared Dillard to Marcos M
Updated by Jim Pingle about 5 years ago
- Status changed from New to Pull Request Review
- Target version set to 2.6.0
 Updated by Renato Botelho about 5 years ago
- Status changed from Pull Request Review to Feedback
PR has been merged. Thanks!
Updated by Marcos M almost 5 years ago
- File monitoring.png monitoring.png added
- Status changed from Feedback to Resolved
Now works on Firefox and Edge/Chromium.
On mobile resolutions, some labels clip on the right instead, though I think that's a fix for when the whole graphing library gets updated as it's currently years old.