Feature #7122
closed
Add filters to various dashboard widgets
100%
Description
Some dashboard widgets can end up with a lot of rows or columns of data to display on bigger systems. It would be nice to let the user choose which entries to display or not display. e.g. If there are lots of interfaces, then the network admin may want to display just the most important ones that they care about.
Widgets that could have a filter:
- Interfaces
- Interface Statistics
- Gateways
- Wake on LAN
- Dynamic DNS
- OpenVPN
Note: The Services Widget has a multi-select box for filtering. It has now changed to a list of checkboxes to select the items to be shown. The UI for other widgets with a filter selection will use the same scheme.
Files
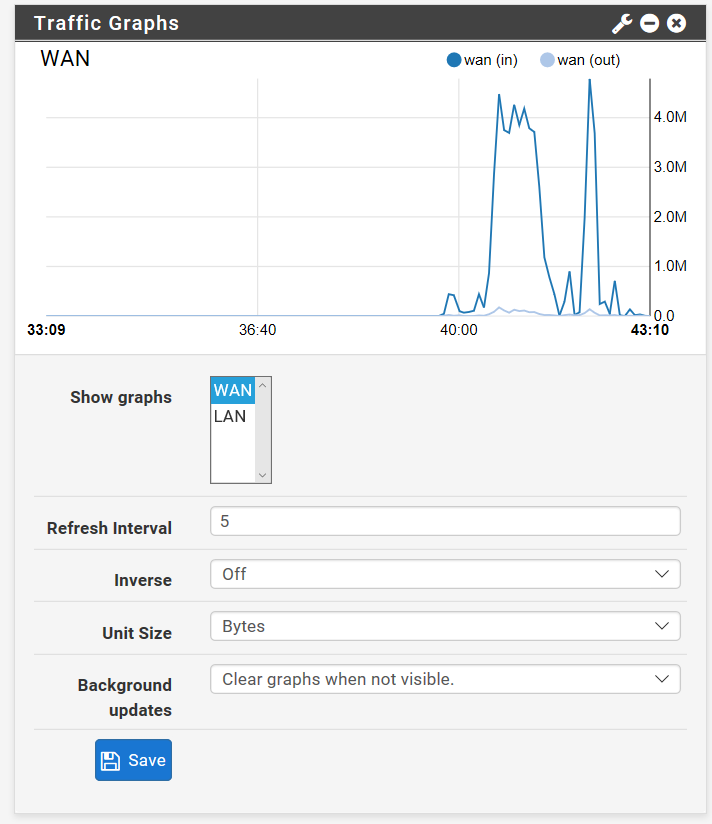
| traffic graph.png (41.2 KB) traffic graph.png | Traffic Graph widget showing changes to interval, interfaces and display style |
 Updated by Phillip Davis over 9 years ago
The following are completed:
Services Widget UI changes: https://github.com/pfsense/pfsense/pull/3370
Interfaces Widget: https://github.com/pfsense/pfsense/pull/3374
Interface Statistics Widget: https://github.com/pfsense/pfsense/pull/3379
Gateways Widget: https://github.com/pfsense/pfsense/commit/a5d486e9ad95d4e63603430c8aabf706fcc03363
Wake on LAN Widget: https://github.com/pfsense/pfsense/pull/3381
I will look at Dynamic DNS and OpenVPN in the next few days.
Usually people do not have many Dynamic DNS entries, but it will be easy to implement the filter, and handy for people who have quite a few or have some testing crud that they do not want to show on the "real day-to-day" dashboard.
My use case for OpenVPN is in a main office that has site-to-site servers for a number of other offices, plus road-warrior server. Some of the sub-offices are "important" and are expected to be online 24/7. Other small or home offices turn their gear off out of hours. So I don't care so much to see if the small offices are up/down on the dashboard. Thus filtering them from the displayed list saves dashboard space, and means that everything on the dashboard is expected to always be up/green.
Updated by Phillip Davis over 9 years ago
Dynamic DNS Widget filtering in PR https://github.com/pfsense/pfsense/pull/3386
Commit https://github.com/pfsense/pfsense/commit/5f8a3dc09e550f3aa2ef086c03e7133f78756913
OpenVPN remaining to do.
Updated by Phillip Davis over 9 years ago
OpenVPN Widget filtering in PR https://github.com/pfsense/pfsense/pull/3392
 Updated by Kill Bill over 9 years ago
@Phil: In case you are bored, could you do one for SMART Status? Did one originally for 2.2.x (https://github.com/pfsense/pfsense/pull/1841) and never got back to it. Still bothered by card readers junk. :D
Updated by Phillip Davis over 9 years ago
Bored enough :) PR https://github.com/pfsense/pfsense/pull/3395
 Updated by Renato Botelho over 9 years ago
- Status changed from New to Feedback
- % Done changed from 60 to 100
All PRs merged, thanks!
Updated by Phillip Davis over 9 years ago
I think that is it. Unless anyone has another favorite, the dashboard widgets can be given a last test and this can be set to resolved.
 Updated by John Murphy over 9 years ago
- Interfaces
- Interface Statistics
- Gateways
- System information
- Traffic Graphs
- SMART
I am able to show / hide various aspects of each of these widgets with no issues. WOL and Dynamic DNS are two that I do not use so couldn't completely test. Option appears to be there to hide aspects of these widgets, but the options are empty because I don't utilize these features on this firewall.
Like this feature a lot. It is nice to hide traffic graphs that I was never interested in monitoring.
Environment tested in: SG-2220 w/ 2.4.0.b.20170301.1546
Updated by Phillip Davis over 9 years ago
Note: The traffic graph widget already had a multi-selector box prior to this feature. That box never got changed to this "new" checkbox system for selecting the items to be displayed.
PR https://github.com/pfsense/pfsense/pull/3602 refactors code in the traffic graphs widget and provides the new checkbox selection UI. It needs review...
 Updated by James Snell over 9 years ago
- File traffic graph.png traffic graph.png added
Build 2.4.0.b.20170314.2306 showing a multi-select box for interfaces, was expecting checkboxes.
Cropped screenshot attached from MS Edge 38.14393.0.0 browser.
Updated by Kill Bill over 9 years ago
James Snell wrote:
Build 2.4.0.b.20170314.2306 showing a multi-select box for interfaces, was expecting checkboxes.
Cropped screenshot attached from MS Edge 38.14393.0.0 browser.
As you can see, the PR (https://github.com/pfsense/pfsense/pull/3602) has not been merged yet, so not really sure what changes you expected (nor how does it matter exactly).
Updated by Phillip Davis over 9 years ago
Once the PR has been reviewed (and hopefully merged) the new checkbox format (like other widgets) will be available. There seems to have been a stop in merging, or even reviewing community PRs the last few weeks.
Updated by Phillip Davis over 9 years ago
With the delay in reviewing/merging community-contributed PRs, I have split PR 3602 up into the various parts that are logically separate along the way to getting the Traffic Graphs widget to work and be coded similar to the other widgets:
https://github.com/pfsense/pfsense/pull/3654 Traffic Graphs Widget whitespace
https://github.com/pfsense/pfsense/pull/3655 Traffic graph widget filter checkboxes
https://github.com/pfsense/pfsense/pull/3656 Traffic Graphs Widget handle no items selected for display
The above gets the Traffic Graphs widget code and functionality to match the other widgets.
Then:
https://github.com/pfsense/pfsense/pull/3657 Redmine 7318 None button for Traffic Graphs Widget filter
implements the "None" button functionality proposed in Redmine 7318, which is a separate issue.
Hopefully there will be some movement in the community code review process soon.
Updated by Kill Bill over 9 years ago
Phillip Davis wrote:
With the delay in reviewing/merging community-contributed PRs, I have split PR 3602 up into the various parts that are logically separate along the way to getting the Traffic Graphs widget to work and be coded similar to the other widgets:
Hopefully there will be some movement in the community code review process soon.
Not really sure what's up, but I'm pretty much giving up ATM. I've lost track of things (having 31 open PRs right now for pfSense repo alone) and chances are high the PRs will conflict with each other.
Updated by James Snell over 9 years ago
Looks like the PR went in about 48hours after the last note.
Tested using build 2.4.0.b.20170412.1256
Checked the following widgets
- Interfaces
- Interface Statistics
- Gateways
- System information
- Traffic Graphs
- SMART Status
All have checkboxes for content selection in the widget settings.
Looks like this one can be closed. Thanks!
 Updated by Jim Pingle almost 9 years ago
- Status changed from Feedback to Resolved
All the filters I've tried work well. Looks good from here. Closing.