Regression #12069
closed
Panic in ``pfctl`` with large numbers of states
0%
Description
Only one report of this so far, so it's unclear how many it may affect. User reports that with ~45k states, pfctl becomes slow when dumping the state table contents and can run out of memory, leading to a panic. Similar in some ways to #12045 but it doesn't manifest as quickly.
Kristof said "I’m assuming it’s a bug in the cleanup if we fail a memory allocation. I’d have to look at the code a bit closer. It might also be an nvlist issue."
Textdump contents attached.
db:0:kdb.enter.default>  bt
Tracing pid 53869 tid 100554 td 0xfffff8001786c000
kdb_enter() at kdb_enter+0x37/frame 0xfffffe001905dec0
vpanic() at vpanic+0x197/frame 0xfffffe001905df10
panic() at panic+0x43/frame 0xfffffe001905df70
trap_fatal() at trap_fatal+0x391/frame 0xfffffe001905dfd0
trap_pfault() at trap_pfault+0x4f/frame 0xfffffe001905e020
trap() at trap+0x286/frame 0xfffffe001905e130
calltrap() at calltrap+0x8/frame 0xfffffe001905e130
--- trap 0xc, rip = 0xffffffff811dc654, rsp = 0xfffffe001905e200, rbp = 0xfffffe001905e250 ---
uma_zfree_arg() at uma_zfree_arg+0x24/frame 0xfffffe001905e250
free() at free+0x5a/frame 0xfffffe001905e280
nvpair_free() at nvpair_free+0x99/frame 0xfffffe001905e2a0
nvlist_destroy() at nvlist_destroy+0x60/frame 0xfffffe001905e2d0
pf_state_to_nvstate() at pf_state_to_nvstate+0x94/frame 0xfffffe001905e310
pfioctl() at pfioctl+0x1b27/frame 0xfffffe001905e7e0
devfs_ioctl() at devfs_ioctl+0xb0/frame 0xfffffe001905e830
VOP_IOCTL_APV() at VOP_IOCTL_APV+0x7b/frame 0xfffffe001905e860
vn_ioctl() at vn_ioctl+0x16c/frame 0xfffffe001905e970
devfs_ioctl_f() at devfs_ioctl_f+0x1e/frame 0xfffffe001905e990
kern_ioctl() at kern_ioctl+0x2b7/frame 0xfffffe001905e9f0
sys_ioctl() at sys_ioctl+0x101/frame 0xfffffe001905eac0
amd64_syscall() at amd64_syscall+0x387/frame 0xfffffe001905ebf0
fast_syscall_common() at fast_syscall_common+0xf8/frame 0xfffffe001905ebf0
Files
| 1624352069351-version.txt (61 Bytes) 1624352069351-version.txt | |||
| 1624352069347-panic.txt (10 Bytes) 1624352069347-panic.txt | |||
| 1624352039171-msgbuf.txt (95.9 KB) 1624352039171-msgbuf.txt | |||
| 1624352039167-ddb.txt (48 KB) 1624352039167-ddb.txt | |||
| rose-textdump.tar (154 KB) rose-textdump.tar | |||
| panic-message.png (71 KB) panic-message.png | |||
| panic-ddb.png (116 KB) panic-ddb.png |
Related issues
 Updated by Jim Pingle about 5 years ago
- File rose-textdump.tar rose-textdump.tar added
- Priority changed from Normal to Urgent
- Target version changed from 2.6.0 to 2.5.2
I can reproduce this now but it took a few tries.
Here is what I did:
First, set the firewall to conservative mode so states stay around longer, which helps artificially increase the state table size.
On a Linux client (mint, for me) behind pfSense:
sudo -s
add-apt-repository ppa:dns-oarc/dnsperf
apt-get update
apt-get install dnsperf resperf
wget https://www.dns-oarc.net/files/dnsperf/data/queryfile-example-10million-201202.gz
gzip -d queryfile-example-10million-201202.gz
Run resperf-report in one terminal window, start it again when it stops
sudo -s
ulimit -n 1000000
resperf-report -d queryfile-example-10million-201202 -C 25000 -s <ip of pfsense>
In two or more additional terminal windows:
sudo nmap -sU -T4 -v -p1-65535 --min-hostgroup 16 --version-intensity 0 <some chunk of the WAN subnet>
Keep the commands running and watch the states.
On an ssh session to the firewall, check "pfctl -si | grep -A4 State" and see how many states are in the table.
On another ssh session to the firewall, run "time pfctl -ss > /dev/null" and watch it take longer and longer as the state table size increases. One one system, it started taking 1m30s at around 30k states, and by the time it hit 60k it was taking nearly 5 minutes to finish.
In the system where I could reproduce the pfctl panic, the state table size was 200k on a VM with 512MB RAM and 2G of swap. Eventually the system run out of RAM and kills processes or hits a panic.
To induce the condition sooner, you can (a) run "time pfctl -ss > /dev/null &" a few times to spawn more instances of pfctl, and (b) if it's ZFS, run "find /"
Updated by Jim Pingle about 5 years ago
- Related to Regression #12045: High CPU usage and slowness with ``pfctl -ss`` added
Updated by Jim Pingle about 5 years ago
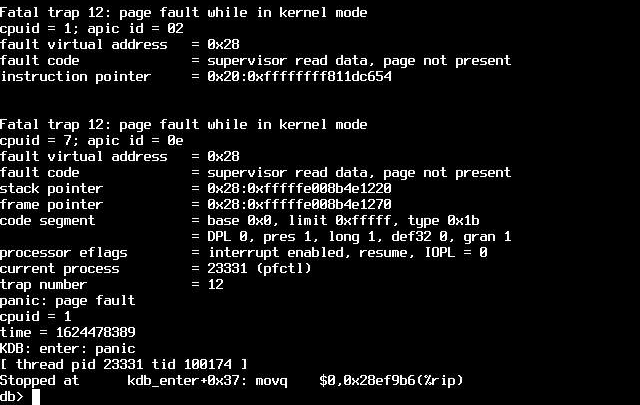
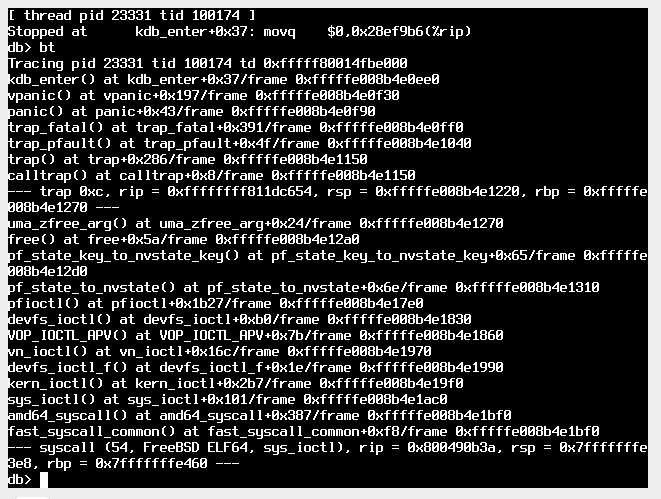
- File panic-message.png panic-message.png added
- File panic-ddb.png panic-ddb.png added
Additional panic output from a system in the test lab with >1M states
 Updated by Patrick Sanderson about 5 years ago
Retested on pfSense+ 21.05. Found the systems still pass traffic, even with 7.1M states.
pfSenseCE 2.5.2 did not pass any traffic, even at the start of the test.
With pfSense+ 21.05:
[21.05-RELEASE][root@XG-1541-DUT-2.test.netgate.com]/root: ps aux | grep pfctl
root  9491   3.5  0.2 3687560 35032  0  D    15:34     0:10.27 pfctl -ss
root 14881   3.4  0.2 3687560 34752  0  D    15:34     0:10.21 pfctl -ss
root  7296   3.2  0.2 3687560 35452  0  D    15:34     0:10.37 pfctl -ss
root 14730   3.2  0.2 3687560 34696  0  D    15:34     0:10.26 pfctl -ss
root 14908   3.1  0.2 3687560 34496  0  D    15:34     0:10.20 pfctl -ss
root 15046   3.0  0.2 3687560 34692  0  D    15:34     0:10.19 pfctl -ss
root 57705   2.9  0.4 3687560 65428  -  DN   15:33     0:15.56 /sbin/pfctl -ss
root 84689   0.0  0.0   11204  2476  0  S+   15:39     0:00.00 grep pfctl
Is still running even after the state table has decayed back to ~10 states.
 Updated by Greg M about 5 years ago
I have more details...
I unplug LAN and WAN cable and wait 4-5 minutes.... Then I plug them both in. After few seconds unbound goes crazy and generates between 90k and 110k states.
RAM goes bye-bye, CPU goes to 100% system panics and reboots itself. In normal conditions I have 800-2000 states and no more.
I noticed this when I rebooted Cisco switch.
I have set up that unbound resolves directly, without forwarders. If do the same scenarion again, but DISABLE unbound, there are no states generated, so maybe this is unbound issue as well?
 Updated by M Felden about 5 years ago
Issue unlikely to be limited to or related to Unbound. Unbound was mentioned originally in the context that it is a good attack vector for creating states in a lab to replicate the issue with DNSperf to try and replicate the issue. When the issue was originally discovered in the wild it was a server that is serving NTP with almost all of the ~40k states all being NTP related.
Updated by Jim Pingle about 5 years ago
This issue doesn't have anything to do with Unbound directly. The screenshots I added above were from a system which was only passing packets during a load test, it wasn't doing DNS.
If there is some other problem in the case you mentioned with Unbound, it would warrant further discussion and diagnosis on the forum first, then if it turns out to be a legitimate reproducible problem, it would need its own separate Redmine.
Updated by Jim Pingle about 5 years ago
- Status changed from New to Feedback
We'll have a new RC build soon with the pf changes rolled back so we're closer to the previous version in that area. After that has been tested, we can re-target this to 2.6.0/21.09 for a proper long-term fix. Testing on internal builds has been solid so far, but there are a few more changes to make yet before publishing the new builds.
Updated by Jim Pingle about 5 years ago
2.5.2.r.20210629.1350 looks good to me. pfctl -ss is fast and I'm not seeing any slow down or memory pressure like before. We still need a throughput test result from Patrick to be sure.
Updated by Jim Pingle about 5 years ago
- Release Notes changed from Default to Force Exclusion
Excluding from release notes since it's not going to be a problem in any release (introduced in snapshots and fixed there as well)
Updated by Jim Pingle about 5 years ago
- Status changed from Feedback to In Progress
- Target version changed from 2.5.2 to 2.6.0
All reports indicate this is OK on 2.5.2 since the changes were backed out. Will need to check it again after additional work goes into 2.6.0 and gets merged.
 Updated by Mateusz Guzik almost 5 years ago
With the introduction of DIOCGETSTATESV2 this problem should probably be considered resolved.
Updated by Jim Pingle almost 5 years ago
- Status changed from In Progress to Feedback
Needs some final testing/confirmation yet now that the other work is done.
Updated by Jim Pingle over 4 years ago
- Plus Target Version changed from 21.09 to 22.01
Updated by Jim Pingle over 4 years ago
- Status changed from Feedback to Resolved
No sign of this being a problem since the fix went in.