Bug #13014
closed
Deadlock in Charon VICI interface
100%
Description
The charon.vici daemon can get in a bad state where all of the qlen slots are "hung". This causes the Status --> IPSec and other webConfigurator elements to not properly display status. This may not always affect the actual tunnel traffic, but you cannot restart any of the tunnels, manually disconnect or connect them, restart the IPSec service, view the connected status of any Phase 1 or 2 tunnels, etc.
When this happens you will start seeing the following in the System Logs:
kernelsonewconn: pcb 0xfffff8011994b700: Listen queue overflow: 5 already in queue awaiting acceptance (1 occurrences)
You will also see this in netstat:
Current listen queue sizes (qlen/incqlen/maxqlen)
unix 5/0/3 /var/run/charon.vici
Files
| kdump.JPG (43.2 KB) kdump.JPG | |||
| charon_crash_ktrace.txt (6.25 KB) charon_crash_ktrace.txt | |||
| procstat_on_failed_charon.txt (10.7 KB) procstat_on_failed_charon.txt | |||
| ipsec_status_all.txt (39.5 KB) ipsec_status_all.txt | |||
| swanctl.conf (36.3 KB) swanctl.conf | |||
| strongswan.conf (975 Bytes) strongswan.conf | |||
| gdb_deadlocked_charon.txt (34.6 KB) gdb_deadlocked_charon.txt |
Related issues
 Updated by Jim Pingle over 4 years ago
Might be the same root cause as #7420 though we don't have enough information about either one of these to say for certain. The symptoms are very similar, though.
I can't replicate this on demand, I've seen it happen maybe once or twice ever when working on IPsec code. There are a couple reports on the forum and reddit as well.
As far as I know, though, nobody can induce it reliably.
Updated by Jim Pingle over 4 years ago
- Related to Bug #7420: ipsec status freezing added
 Updated by Pierre-Emmanuel DEGRYSE over 4 years ago
Hi. I get the same error.
See below the IPSecs logs with the highest verbosity level:
Apr 11 09:48:49    charon    23603    07[JOB] watcher going to poll() 6 fds
Apr 11 09:48:49    charon    23603    07[JOB] watching 24 for reading
Apr 11 09:48:49    charon    23603    07[JOB] watching 23 for reading
Apr 11 09:48:49    charon    23603    07[JOB] watching 18 for reading
Apr 11 09:48:49    charon    23603    07[JOB] watching 13 for reading
Apr 11 09:48:49    charon    23603    07[JOB] watching 8 for reading
Apr 11 09:48:49    charon    23603    07[JOB] watcher got notification, rebuilding
Apr 11 09:48:49    charon    23603    03[CFG] vici client 35 disconnected
Apr 11 09:48:49    charon    23603    07[JOB] watcher going to poll() 6 fds
Apr 11 09:48:49    charon    23603    07[JOB] watching 24 for reading
Apr 11 09:48:49    charon    23603    07[JOB] watching 23 for reading
Apr 11 09:48:49    charon    23603    07[JOB] watching 18 for reading
Apr 11 09:48:49    charon    23603    07[JOB] watching 13 for reading
Apr 11 09:48:49    charon    23603    07[JOB] watching 8 for reading
Edit: removed redundant info.
 Updated by Kris Phillips over 4 years ago
Someone with this issue:
If you could please run:
ps aux | grep charon
Output should look something like this, with the bold number being important: root 35176 0.0 0.2 68960 19560 - I Thu21 0:06.64 /usr/local/libexec/ipsec/charon --use-syslog
ktrace -p [the PID of the charon process here from the above command]
kdump
Then please provide the output here in a redmine response. That will be most helpful in investigating this issue and resolving it.
 Updated by Tobias Ock about 4 years ago
Hi,
after updating to pfSense Plus 22.01 on XG-7100 I get this issue too.
As a side note... We also changed the ports from 1Gb to 10Gb in this step
Unfortunately, kdump doesn't give me any output
Updated by Kris Phillips about 4 years ago
FYI, this seems to help: if you go to System --> Advanced --> System Tunables and change kern.ipc.soacceptqueue to at least 512, then reboot, it seems to abate whatever condition is causing this.
 Updated by Brad Davis about 4 years ago
- Assignee set to Mateusz Guzik
- Target version set to 2.7.0
- Plus Target Version set to 22.05
We think this is fixed, but need additional testing to know for sure.
 Updated by Mateusz Guzik about 4 years ago
No, this is not fixed. However, chances are excellent this is an old & known bug: use-after-free in key-related state in ipsec. I have a patch to fix that bit, but it was not committed yet as running with it runs into another bug.
The idea will be to boot a kernel with custom debug which will either confirm the suspicion is correct OR give a starting point for investigation if not.
Updated by Jim Pingle about 4 years ago
- Plus Target Version changed from 22.05 to 22.09
Updated by Jim Pingle about 4 years ago
- Plus Target Version changed from 22.09 to 22.11
 Updated by Chris W about 4 years ago
We suggested this bug may be the cause of what the customer is seeing in 945855019. His experience is that the tunnels are down and not passing traffic, however, and the only thing which restores those connections is a reboot.
 Updated by Jesse Ortiz about 4 years ago
Hello, I have been working with technical support on this issue and was told to upgrade to version Pfsense Plus 22.05 version and the issue persisted.
There is a community post with more details than this bug tracker to help resolve the issue.
https://forum.netgate.com/topic/172075/my-ipsec-service-hangs/34
Hope the comments and details provided on this post help get it fixed.
 Updated by Gassy Antelope almost 4 years ago
- File charon_crash_ktrace.txt charon_crash_ktrace.txt added
Here's a kernel trace that shows what occurs when it crashes. I know the previous dump someone posted didn't show anything, because it was done after it crashed. I had the trace going the whole time until it crashed, ending up with a 2GB file. The file I've included is just the last 100ish lines from it (IPs redacted). Hopefully we can get this fixed finally.
Updated by Kris Phillips almost 4 years ago
FYI I had a customer who had a box working fine for years, but it had some slow performance due to high CPU usage. Upon enabling AES-NI 24 hours ago for IPSec the box had this issue crop up. Might be totally unrelated as I had no way of verifying in the moment that AES-NI was the culprit, but I'd be curious if someone with this issue could test with AES-NI disabled to see if it magically eliminates their problem.
Updated by Gassy Antelope almost 4 years ago
Interesting, I'll go ahead and disable AES-NI and see what happens.
Updated by Gassy Antelope almost 4 years ago
It doesn't appear to be related to AES-NI. Had the issue happen a couple times with AES-NI disabled.
 Updated by David Vazquez almost 4 years ago
I've been having the same issue as everyone above so I wrote a script to restart the necessary services when the problem occurs. I run this every minute via cron job. It's quick and dirty but it gets the job done. Hope this helps!
#!/bin/sh

queueLength=$(netstat -Lan | grep charon.vici | cut -c 7)

if [ $((queueLength)) -gt 0 ]; then

            /usr/bin/killall -9 charon
            /usr/local/sbin/pfSsh.php playback restartipsec; sleep 10; /usr/local/sbin/pfSsh.php playback restartipsec

else

fi
 Updated by Mikael Karlsson almost 4 years ago
David Vazquez wrote in #note-17:
I've been having the same issue as everyone above so I wrote a script to restart the necessary services when the problem occurs. I run this every minute via cron job. It's quick and dirty but it gets the job done. Hope this helps!
[...]
Can confirm the same bug on a Netgate SG-4860 running 22.01, the fix above works really well. Thank you!
Updated by Jim Pingle almost 4 years ago
- Plus Target Version changed from 22.11 to 23.01
Updated by Gassy Antelope almost 4 years ago
Is there any idea when this issue may get fixed? It keeps being endlessly pushed back to the next version. The forum thread has more and more people stating that they are experiencing the problem. I'd consider this a high priority fix, since IPsec VPN's are a basic feature in firewalls and they break multiple times a day in pfSense. I get emails from Netgate about them providing "high-performance firewall, VPN, and routing solutions," "most trusted firewall," and "best meets requirements," yet it seems to be the only firewall I've ever seen where IPsec VPN's don't work properly. It's kind of embarassing to be bragging about that type of stuff when issues like this exists for 6+ months and are ignored.
Updated by Jim Pingle almost 4 years ago
It didn't get pushed back to the next version, there won't be a 22.11 as there is still a significant amount of work to be done and not enough time to get it all well tested before November.
The current hope is to fix this for the next release, and that next release will be 23.01.
Updated by Kris Phillips over 3 years ago
EDIT:
Disregard this. Did not permanently resolve the issue, but only seemed to help slow it down.
ORIGINAL:
Another possible dead-end, but maybe not:
I had a customer today who ran into this issue. I discovered that logging files with bzip compression was causing charon.vici to hang up for some reason. Setting compression to None, resetting the log files, and then running "/usr/bin/killall -9 charon" + an IPsec service restart fixed the issue. They were running into this within 2-3 minutes after rebooting and had the same symptoms. Afterwards they were fine for 10 minutes straight.
Again, this may entirely be a rabbit trail and could prove to be unrelated or irrelevant, but anytime I find a possible "root cause" I will try to continue documenting it here. It's also possible that sources of this problem are varied and the charon process can get hung up for a multitude of reasons.
 Updated by Kristof Provost over 3 years ago
Based on available information the suspicion is that charon itself is deadlocking, which matches the described symptoms (no vici interaction, traffic keeps flowing) and the kdump.
Unfortunately there are a lot of locks in the charon code and it's not clear where this deadlock might be happening.
Ideally we'd need to be able to reproduce this. Until it's figured out how there are a couple of things we can try that may provide hints.
The first would be to run `ipsec statusall` on an affected but currently correctly working machine, as well as dumping the contents of /var/etc/ipsec/strongswan.conf and /var/etc/ipsec/swanctl.conf
Then, on a machine in the bad state, `procstat -t <pid>`, `procstat -f <pid>` and `procstat -k <pid>` on the "daemon: /usr/local/libexec/ipsec/charon" process.
The ideal situation would be that we were able to reproduce this so that we could investigate an affected charon process with gdb, but until then we'll have to gather whatever small clues we can find.
Updated by David Vazquez over 3 years ago
- File procstat_on_failed_charon.txt procstat_on_failed_charon.txt added
- File ipsec_status_all.txt ipsec_status_all.txt added
- File swanctl.conf swanctl.conf added
- File strongswan.conf strongswan.conf added
Kristof Provost wrote in #note-23:
Based on available information the suspicion is that charon itself is deadlocking, which matches the described symptoms (no vici interaction, traffic keeps flowing) and the kdump.
Unfortunately there are a lot of locks in the charon code and it's not clear where this deadlock might be happening.Ideally we'd need to be able to reproduce this. Until it's figured out how there are a couple of things we can try that may provide hints.
The first would be to run `ipsec statusall` on an affected but currently correctly working machine, as well as dumping the contents of /var/etc/ipsec/strongswan.conf and /var/etc/ipsec/swanctl.conf
Then, on a machine in the bad state, `procstat -t <pid>`, `procstat -f <pid>` and `procstat -k <pid>` on the "daemon: /usr/local/libexec/ipsec/charon" process.The ideal situation would be that we were able to reproduce this so that we could investigate an affected charon process with gdb, but until then we'll have to gather whatever small clues we can find.
Here are the files you requested. 'ipsec statusall' before any issues and then the rest of the commands during the issue. Let me know if I can be of more help. This issue usually happens multiple times per day so I can re-run commands whenever you need.
Updated by Kristof Provost over 3 years ago
Thanks for that.
There's nothing obviously suspect in the status or configuration files. I do see you have a fair number of ipsec connections set up. Can other affected people comment on their number of connections? It's entirely possible that a larger number of tunnels makes this more likely to happen, and that'd be good to know.
The procstat output also seems to confirm that we're looking at a deadlock in charon. I see threads waiting for a read lock on a read/write lock, other threads waiting for a write lock and others waiting for a mutex. Here too it would be interesting to have more samples.
Short version: more procstat output and reports of number of ipsec connections on affected instances. There's no need for more ipsec statusall or configuration files.
Updated by Kris Phillips over 3 years ago
Kristof Provost wrote in #note-25:
Thanks for that.
There's nothing obviously suspect in the status or configuration files. I do see you have a fair number of ipsec connections set up. Can other affected people comment on their number of connections? It's entirely possible that a larger number of tunnels makes this more likely to happen, and that'd be good to know.
The procstat output also seems to confirm that we're looking at a deadlock in charon. I see threads waiting for a read lock on a read/write lock, other threads waiting for a write lock and others waiting for a mutex. Here too it would be interesting to have more samples.
Short version: more procstat output and reports of number of ipsec connections on affected instances. There's no need for more ipsec statusall or configuration files.
Hello Kristof,
While not always the case, in about 90%+ of cases I've seen with this issue there are at least 15-20 tunnels, if not 50+ involved. I have saw this issue with as low as 4-5, but it's significantly more common with more tunnels.
Updated by Mikael Karlsson over 3 years ago
Kris Phillips wrote in #note-26:
Kristof Provost wrote in #note-25:
Thanks for that.
There's nothing obviously suspect in the status or configuration files. I do see you have a fair number of ipsec connections set up. Can other affected people comment on their number of connections? It's entirely possible that a larger number of tunnels makes this more likely to happen, and that'd be good to know.
The procstat output also seems to confirm that we're looking at a deadlock in charon. I see threads waiting for a read lock on a read/write lock, other threads waiting for a write lock and others waiting for a mutex. Here too it would be interesting to have more samples.
Short version: more procstat output and reports of number of ipsec connections on affected instances. There's no need for more ipsec statusall or configuration files.
Hello Kristof,
While not always the case, in about 90%+ of cases I've seen with this issue there are at least 15-20 tunnels, if not 50+ involved. I have saw this issue with as low as 4-5, but it's significantly more common with more tunnels.
Regarding the number of tunnels, we have 14 phase 1 entries and a fairly large number of phase 2 entries (80+), most of the tunnels are disconnected most of the time, but at normally there are 1-5 phase 1 connections with a total of 15-20 phase 2 connections that are active. The crash happens roughly once every 12-24h.
 Updated by
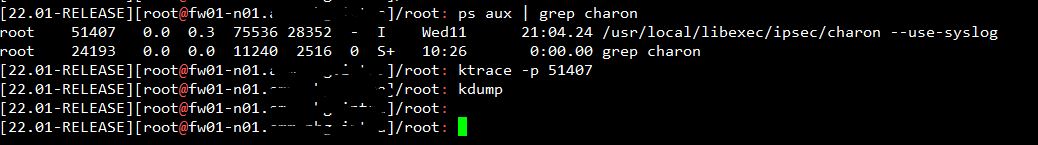
 Updated by Dan Bailey over 3 years ago
We have tried everything based on....
https://forum.netgate.com/topic/172075/my-ipsec-service-hangs/6
We now have over 50 IPsec tunnels (50 P1, ~150 P2) and through trial and error have some theorys to what causes loss of all IPsec (and the management UI)
Often we have to spend days working with a customer to get a VPN working. If we cannot establish due to a mismatch and leave the IPsec 'trying' to establish, that's when it brings everything crashing down. Even after the VPN is established if we fail to spot a VPN down we can have same issue. We have had loss of IPsec / man UI several times in a single day. Now if a VPN goes down or is incomplete we disable it till the customer side is ready which does help somewhat.
When IPsec fails it usually take man UI with it, though NAT etc still functional.
Things we have tried -
Reducing IPsec log chatter in log settings
Running cron job to delete log archives so they never 'roll over' (probably a red herring)
Hotfix provided by tech support based on this bug (though this was only for a IPsec UI bug afaik)
Providing detailed logs to tech support
Our latest attempt we are trying is to disable all disk based logging on FW, and instead rely on a external syslogger.
Will post back results over time.
It is 100% not AES-NI as we have have same issues on or off.
The longest we have had FW running without issues is 45days, even this is unacceptable.
My only advice for others for now is don't leave IPsec VPNs 'trying' to connect.
Updated by Kristof Provost over 3 years ago
I've tried running charon under valgrind's helgrind and drd tools. The idea was to identify any lock misuse or lock order reversals that could produce a deadlock, but unfortunately nothing like that turned up.
I've also had no luck reproducing it, which would have allowed attaching with gdb for inspection and might have yielded more clues.
Updated by David Vazquez over 3 years ago
Kristof Provost wrote in #note-30:
I've tried running charon under valgrind's helgrind and drd tools. The idea was to identify any lock misuse or lock order reversals that could produce a deadlock, but unfortunately nothing like that turned up.
I've also had no luck reproducing it, which would have allowed attaching with gdb for inspection and might have yielded more clues.
Kristof, is there anything else I can provide for you that would help? The issue usually occurs at least once a day so it wouldn't be long before I would have the system in a failed state.
Updated by Kristof Provost over 3 years ago
A way to reproduce it reliably, but I appreciate that that's not easy (I've been trying to get one for two days, after all!).
Absent that we could build a strongswan package with debug symbols included for you to run so that we can attach gdb when it's in the bad state. Unfortunately I'm heading out on an extended vacation myself, so I won't be able to do that soon (or follow up on it).
I've left my notes here in part so that you'd know this is being worked on, and for my colleagues to know what I've tried so far.
Updated by Kristof Provost over 3 years ago
I've built strongswan packages for 22.05 (should also work on 2.6.0) and 23.01:
https://people.freebsd.org/~kp/strongswan-5.9.5.pkg (22.05)
https://people.freebsd.org/~kp/strongswan-5.9.8.pkg (23.01)
To be clear: all these do is add debug information. They are not expected to fix the issue.
To test with them:
- back up your configuration
 - install gdb (pkg install gdb)
 - copy the relevant package to the device
 - pkg add -f strongswan-5.9.5.pkg
 - reboot
Wait for the problem to recur, when it does log in again, find the pid of `/usr/local/libexec/ipsec/charon --use-syslog` and run gdb: /usr/local/bin/gdb -p <pid>
In gdb the immediate thing to look at is the backtrace for all threads. Use `thread apply all bt`.
That'll produce a number (~17) of backtraces. The hope is that those will give us a hint as to how the deadlock happens.
 Updated by Rafał Kaźmierowski over 3 years ago
we have new developers for this topic Hi Mateusz.
I Have this same issue in my configuration on production. One or 3 times a Week my Ipsec frezze on P2.
Updated by David Vazquez over 3 years ago
I am running 2.7.0.a.20221202.0600 on my firewall at the current time so I installed the strongswan package above for 23.01. Here's the output of the above commands. You probably only needed the end bit with the backtraces but I figured I'd include it all for good measure.
 Updated by Roman Kazmierczak over 3 years ago
I have some 40+ spoke firewalls with new ones deploying weekly. Each FW is initiating 3 IPSec VPNs.
While the VPN is connected there is no issue for over a year.
However, if the FW is up but it is unable to establish connection due to external connectivity issues, after only few days IPSec service will fail.
With this information I've configured our hub FW, so all connections are set as responders only. Interestingly HUB is still attempting to initiate the connection, and with number of unreachable spokes, it is failing and require regular reboot (every 10~24h).
 Updated by james greenhill over 3 years ago
Jim Pingle wrote in #note-21:
It didn't get pushed back to the next version, there won't be a 22.11 as there is still a significant amount of work to be done and not enough time to get it all well tested before November.
The current hope is to fix this for the next release, and that next release will be 23.01.
Will a fix for this problem be included in the 23.01 release in the end ?
thanks
Updated by Dan Bailey over 3 years ago
Regarding my previous experiment turning off disk logging, we just had IPsec total fail due to just a few p2 of 150+ not being up after a few days
Also not able to log into management UI as usual so just power cycled in AWS
Updated by David Vazquez over 3 years ago
After a couple mentions of Phase 2 connections being down, I decided to do a test. On the affected firewall, I had a few tunnels that were down more often than they were up. That's mostly due to primary internet connections being active 99.9% of the time and the backup internet connections not being used. I disabled or removed ALL tunnels that were not actively connected and in use. It's been over 48 hrs and the charon issue has not occurred. Previously, I'd have the issue about 2x a day. Clearly this isn't a solution as I need to have my backup VPNs in place but this might be useful information for the devs to look further into the issue.
Updated by Jim Pingle over 3 years ago
David Vazquez wrote in #note-39:
After a couple mentions of Phase 2 connections being down, I decided to do a test. On the affected firewall, I had a few tunnels that were down more often than they were up. That's mostly due to primary internet connections being active 99.9% of the time and the backup internet connections not being used. I disabled or removed ALL tunnels that were not actively connected and in use. It's been over 48 hrs and the charon issue has not occurred. Previously, I'd have the issue about 2x a day. Clearly this isn't a solution as I need to have my backup VPNs in place but this might be useful information for the devs to look further into the issue.
I have a lot of connections that stay down in my lab for various reasons, but they can connect if needed (on demand or manually) -- and no problems here. What sort of tunnels are these? How exactly are they a "backup"? Are they Tunnel mode or VTI? Are they overlapping/duplicated in some way?
Updated by David Vazquez over 3 years ago
Jim Pingle wrote in #note-40:
I have a lot of connections that stay down in my lab for various reasons, but they can connect if needed (on demand or manually) -- and no problems here. What sort of tunnels are these? How exactly are they a "backup"? Are they Tunnel mode or VTI? Are they overlapping/duplicated in some way?
I suppose I should have used the word "Failover" vs "Backup". They are in tunnel mode. I have many sites that have dual internet connections. My office does as well. In order to have the connection failover to a secondary internet connection using the given IPs, I have to make (2) Phase 1 entries which means the Phase 2 is duplicated between both Phase 1 entries. From my understanding, pfSense doesn't allow you to add in multiple Gateway IPs in a single Phase 1 entry, so this is how I've accomplished what I'm trying to do.
Updated by Jim Pingle over 3 years ago
David Vazquez wrote in #note-41:
Jim Pingle wrote in #note-40:
I have a lot of connections that stay down in my lab for various reasons, but they can connect if needed (on demand or manually) -- and no problems here. What sort of tunnels are these? How exactly are they a "backup"? Are they Tunnel mode or VTI? Are they overlapping/duplicated in some way?
I suppose I should have used the word "Failover" vs "Backup". They are in tunnel mode. I have many sites that have dual internet connections. My office does as well. In order to have the connection failover to a secondary internet connection using the given IPs, I have to make (2) Phase 1 entries which means the Phase 2 is duplicated between both Phase 1 entries. From my understanding, pfSense doesn't allow you to add in multiple Gateway IPs in a single Phase 1 entry, so this is how I've accomplished what I'm trying to do.
Having overlapping P2 networks isn't really supported either, and could be a source of problems. I'm not sure if it's relevant here, though. Failover is typically handled by DNS -- Set the remote endpoint to an FQDN and then have the remote update its FQDN if its primary connection fails.
Do you keep the overlapping connections up at all times or do you disable the "backup" entries until they are needed?
Updated by David Vazquez over 3 years ago
Jim Pingle wrote in #note-42:
Having overlapping P2 networks isn't really supported either, and could be a source of problems. I'm not sure if it's relevant here, though. Failover is typically handled by DNS -- Set the remote endpoint to an FQDN and then have the remote update its FQDN if its primary connection fails.
Do you keep the overlapping connections up at all times or do you disable the "backup" entries until they are needed?
Well, the limitation here by using DNS for failover is that I have to wait for however long it takes for the FQDN to be updated before the VPN comes back up. By using hardcoded IPs, the cut over to the failover VPN is pretty much instantaneous.
As for the backup entries, they are usually enabled at all times. Currently disabled and charon has not had a hard lock since I disabled them.
Updated by Jim Pingle over 3 years ago
That could be part of the problem, then, because if there are two P2 entries for the same src/dst in the SPD table it may be having issues keeping them straight. It's not valid to have more than one P2 for the same local/remote network. That it works at all is by luck/chance. Though we'll need to try including that in testing to see if it helps reproduce this particular issue.
Updated by Roman Kazmierczak over 3 years ago
After disabling keepalives on all responders, the IPsec has been up for past 8days. Before that it would fail every 10-12h.
We don't have any traffic towards the remotes which are the initiators.
It seems like the issue is caused when the interesting traffic is unable to bring the tunnel up for some time.
Separate issue but related in some sense is that configuring the tunnel as a responder only, doesn't prevent interesting traffic from initiating the tunnel. I have confirmed that with packet capture.
Updated by Jim Pingle over 3 years ago
- Plus Target Version changed from 23.01 to 23.05
We're still trying to reproduce this and gather data on it, but we are getting closer.
Updated by Dan Bailey over 3 years ago
still happening on pf+ 23.01-RELEASE
if we leave a single VPN trying to connect when other side not configured correctly within hours ipsec completely fails for all and cannot log into UI
we have disk logging off
logs only sent to external syslogger
most VPNs have split phase 2 connections as connecting to older FWs
cannot set to responder only as we usually generate interesting traffic not remote side
around 60-70 IPsec VPNs active, hw crypto enabled (hosted in AWS)
Don't really want to disable keepalives
Updated by Kristof Provost over 3 years ago
The nice people at the Strongswan project think they know what the problem is, and have posted an experimental patch.
Details in https://github.com/strongswan/strongswan/commit/f33cf9376e90f371c9eaa1571f37bd106cbf3ee4
I've built that patch in a package for 23.01. Can someone who's been seeing this issue install this package and confirm (or deny) that it fixes the problem?
https://people.freebsd.org/~kp/strongswan-5.9.8-test.pkg
(Don't forget to`pkg add -f strongswan-5.9.8-test.pkg`)
Should the problem not be fixed they'll need backtraces and the configuration files.
Updated by David Vazquez over 3 years ago
Kristof Provost wrote in #note-48:
I've built that patch in a package for 23.01. Can someone who's been seeing this issue install this package and confirm (or deny) that it fixes the problem?
I implemented the potential fix yesterday morning and the issue has not occurred. I'm going to continue monitoring things for a few days and I'll update here next week.
Updated by Kristof Provost over 3 years ago
Hi David, did you see the issue recur? It'd be very nice to have confirmation so we can land this (and upstream strongswan can too).
Updated by David Vazquez over 3 years ago
Hey Kristof, I have not had the issue recur at all. Seems like it's fixed to me! Thank you for keeping up with it.
Updated by Kristof Provost over 3 years ago
- Status changed from New to Feedback
I've merged the fix to the relevant branches. It will be present in tomorrow's CE and plus snapshots.
Updated by Jim Pingle over 3 years ago
- Assignee changed from Mateusz Guzik to Kristof Provost
- % Done changed from 0 to 100
Updated by Jim Pingle over 3 years ago
- Subject changed from Charon.vici can get in a bad state to Deadlock in Charon VICI interface
Updating subject for release notes.
Updated by Jim Pingle over 3 years ago
- Status changed from Feedback to Resolved