Bug #15196
closed
AWS ena interfaces can become unstable/stop responding
0%
Description
On AMD Epyc hardware in AWS, pfSense Plus ena interfaces can lose their IP addressing and then stop responding entirely.
The following log messages are present when this occurs:
Jan 16 18:34:35 np-aws-001 kernel: ena0: <ENA adapter> mem 0x80404000-0x80407fff at device 5.0 on pci0
Jan 16 18:34:35 np-aws-001 kernel: ena0: Elastic Network Adapter (ENA)ena v2.6.2
Jan 16 18:34:35 np-aws-001 kernel: ena0: Unable to allocate LLQ bar resource. LLQ mode won't be used.
Jan 16 18:34:35 np-aws-001 kernel: ena0: ena_com_validate_version() [TID:100000]: ENA device version: 0.10
Jan 16 18:34:35 np-aws-001 kernel: ena0: ena_com_validate_version() [TID:100000]: ENA controller version: 0.0.1 implementation version 1
Jan 16 18:34:35 np-aws-001 kernel: ena0: LLQ is not supported. Fallback to host mode policy.
Jan 16 18:34:35 np-aws-001 kernel: ena0: Ethernet address: 06:ba:32:98:fd:07
Jan 16 18:34:35 np-aws-001 kernel: ena0: [nm] netmap attach
Jan 16 18:34:35 np-aws-001 kernel: ena0: netmap queues/slots: TX 2/1024, RX 2/1024
and
Jan 19 03:49:07 kernel ena0: Found a Tx that wasn't completed on time, qid 1, index 925. 180522704 usecs have passed since last cleanup. Missing Tx timeout value 5000 msecs.
Jan 19 03:49:07 kernel ena0: Found a Tx that wasn't completed on time, qid 1, index 924. 179482704 usecs have passed since last cleanup. Missing Tx timeout value 5000 msecs.
Jan 19 03:49:07 kernel ena0: Found a Tx that wasn't completed on time, qid 1, index 923. 178472704 usecs have passed since last cleanup. Missing Tx timeout value 5000 msecs.
Jan 19 03:48:54 kernel ena0: Found a Tx that wasn't completed on time, qid 1, index 922. 167002704 usecs have passed since last cleanup. Missing Tx timeout value 5000 msecs.
Files
 Updated by Craig Coonrad over 2 years ago
- Status changed from New to Confirmed
Confirmed.
CPU: AMD EPYC 7571 (2199.98-MHz K8-class CPU)
ena0: Found a Tx that wasn't completed on time, qid 1, index 528. 67990000 usecs have passed since last cleanup. Missing Tx timeout value 5000 msecs.
Updated by Craig Coonrad over 2 years ago
Closed/Fixed FreeBSD bug that appears similar.
Feb 5 20:58:51 awesomehost kernel: ena0: Found a Tx that wasn't completed on time, qid 0, index 0.
 Updated by Jim Thompson over 2 years ago
Hmmm 9272e45 committed Dec 28, 2023
ena: Change measurement unit of time since last tx cleanup to ms
This commit:
1. Sets the time since last cleanup to milliseconds.
2. Fixes incorrect indentations.
Approved by: cperciva (mentor)
MFC after: 2 weeks
Sponsored by: Amazon, Inc.
@ if (unlikely(time_offset > adapter->missing_tx_timeout)) {
if (tx_buf->print_once) {
- time_since_last_cleanup = TICKS_2_USEC(ticks
+ time_since_last_cleanup = TICKS_2_MSEC(ticks -
tx_ring
missing_tx_comp_to = sbttoms(
adapter->missing_tx_timeout);
ena_log(pdev, WARN,
"Found a Tx that wasn't completed on time, qid %d, index %d. "
- "%d usecs have passed since last cleanup. Missing Tx timeout value %d msecs.\n",
+ "%d msecs have passed since last cleanup. Missing Tx timeout value %d msecs.\n",
tx_ring->qid, i, time_since_last_cleanup,
missing_tx_comp_to);
}
@
 Updated by Kristof Provost over 2 years ago
Freeback from Amazon:
Hey,
This is a bit of a dija-vu, I've seen something like this before on ARM platforms where all the IRQs were handled on CPU 0.
Since CPU 0 would be at 100% usage at that time then it would keep postponing the cleanup task eventually causing this error.
We added an option for the driver users to manually spread IRQs over CPUs to ease the pressure on CPU0 (or any other CPU)
I recall this issue happened most with UDP traffic as well since it consumed lots of CPU usage.
Can you please gather more information about CPU usages and system loads around the time of this issue?
Best regards,
Osama
So: do we know anything about the load on affected systems?
Colin also wondered if we've seen this on earlier versions (i.e. 23.05.1 or earlier), and if we've ever seen the warning without associated loss of connectivity.
 Updated by Roberto@ IT and General over 2 years ago
Greetings everyone,
I'm Roberto, from IT Ad General.
I'd like to provide some additional details to help better understand and resolve the issue we're encountering with the pfSense instance on AWS.
The problem described in this ticket was also encountered after we redeployed the pfSense instance using an Intel(R) Xeon(R) Platinum 8259CL CPU @ 2.50GHz (2500.00-MHz K8-class CPU) CPU. Therefore, we are facing identical issues using a different CPU architecture.
Another notable difference we observed is in the configuration:
1. The BIOS Vendor related to our old pfSense testing appliance on AWS is Xen and the network card type assigned to the interfaces is xn . This instance works smoothly
2. The instance facing the issue is running with a BIOS Vendor Amazon EC and network cards type assigned is eni
Hope that would help
Roberto
Updated by Craig Coonrad over 2 years ago
- File image004-1.png image004-1.png added
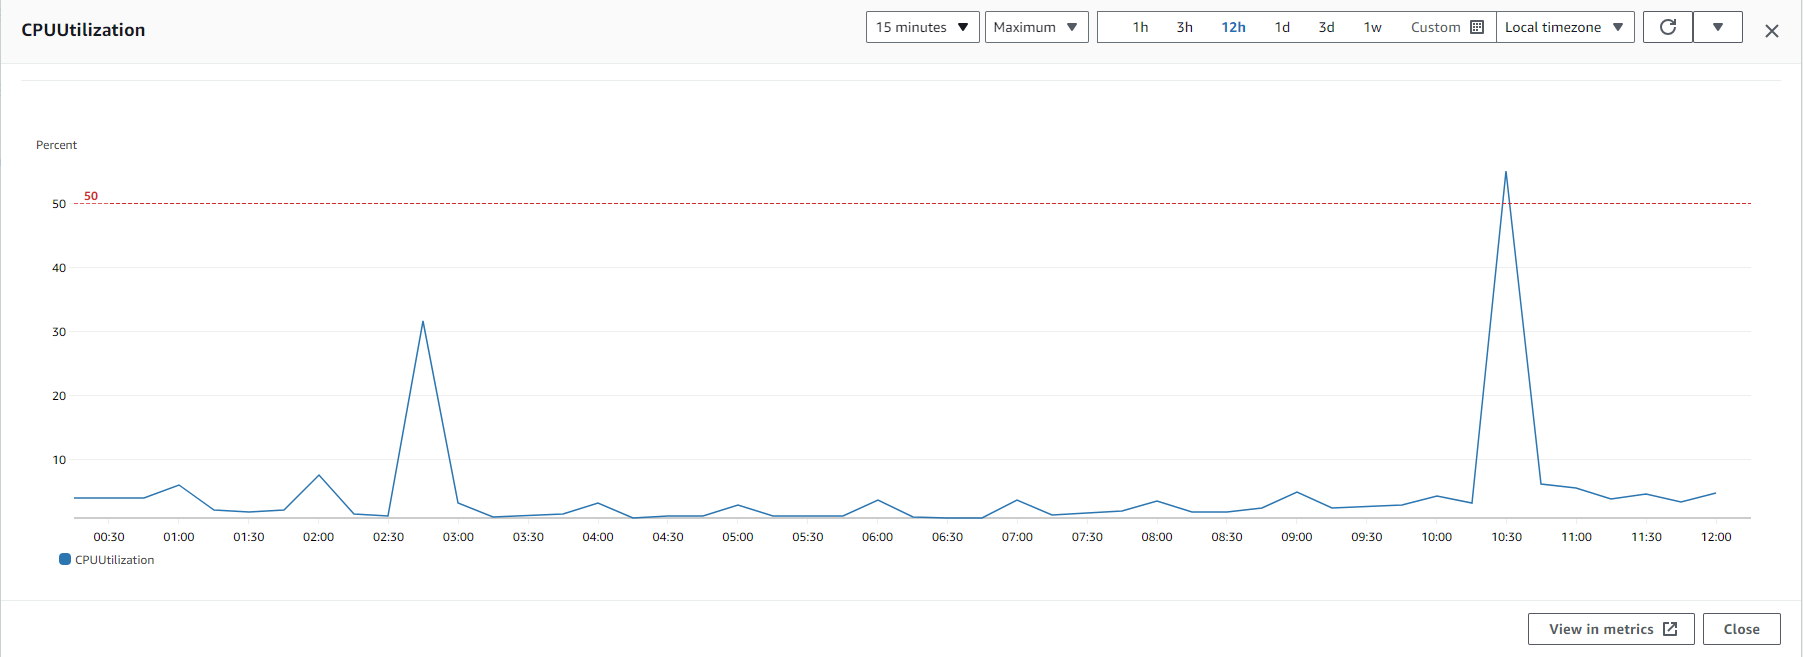
User is reporting this issue manifests in relation to CPU spikes.
Also I want to point that I have a procedure to restart the pfSense if is on 45-50 % CPU usage more then 20 min and that is because we so if it is goes an that CPU is became unresponsive. Here, I would like to display the CPU usage graph, and what's peculiar is that the CPU usage for all spikes begins 5 minutes prior to the top of the hour.
 Updated by Kris Phillips over 2 years ago
Tecsys is requesting an update on this bug report.
 Updated by Lev Prokofev over 2 years ago
Another client hit this issue ticket #2598286486
 Updated by Georgiy Tyutyunnik about 2 years ago
another ticket with this issue
#2694269097
Updated by Kris Phillips about 2 years ago
Another customer in ticket 2706080899 with this issue.
Updated by Kristof Provost about 2 years ago
There's still very little to go on here.
Let's start by seeing if we can identify what's causing the high CPU load. The initial assumption would be that this is something in the ena driver, so please run this dtrace script on the next affected machine:
#!/usr/sbin/dtrace -s

fbt:if_ena::
{

}

profile:::tick-1sec
{
    printf("timeout\n");
    exit(0);
}

dtrace:::END
{
    printf("Done tracing\n");
}
That will automatically end after 1 second, and should give us a list of ena functions being called. Hopefully that will give us an idea of where to concentrate for further investigation.
Additionally, are any of the affected machines running 24.03, or are they all 23.09.01?
 Updated by Chris W about 2 years ago
HS# 2718685720 is a 24.03 guest which was upgraded from 23.09.1. Only when on 24.03 did the problem begin, however.
Updated by Georgiy Tyutyunnik about 2 years ago
new case #2733381806
client will run the script when able to
Updated by Chris W about 2 years ago
- File [24.03-RELEASE][root@pfSense.home.arpa]_script_output.txt [24.03-RELEASE][root@pfSense.home.arpa]_script_output.txt added
Chris W wrote in #note-15:
HS# 2718685720 is a 24.03 guest which was upgraded from 23.09.1. Only when on 24.03 did the problem begin, however.
Result of the dtrace script attached.
Updated by Kristof Provost about 2 years ago
This was on a VM that was manifesting the problem (i.e. elevated CPU use and loss of connectivity) at the time the dtrace script was run?
As far as I can work out from this everything appeared to be working correctly. The trace seems to show the system successfully receiving and sending packets. There's certainly no evidence of excessive CPU use or loss of connectivity here. That doesn't mean it's not there, but I want to be absolutely sure that the system was manifesting the reported problems in this capture, before we draw incorrect conclusions and go off-track trying to chase this down.
Updated by Craig Coonrad about 2 years ago
I looked at the status output for the same case that included the dtrace. It involves high CPU and loss of network. (It is also the first case on 24.03.)
Based on the logs nothing nothing could get out.
sample:
May 17 20:24:37 pfSense syslogd: sendto: No route to host
May 17 20:24:37 pfSense syslogd: sendto: No route to host
May 17 20:24:38 pfSense syslogd: sendto: No route to host
CPU shows:
USER      PID  %CPU %MEM    VSZ   RSS TT  STAT STARTED       TIME COMMAND
root        0 100.0  0.1      0   816  -  DLs  Thu17     51:42.28 [kernel]
I will ask the user if he can gather another dtrace, as well as any other case that emerges.
Updated by Craig Coonrad about 2 years ago
- File 2718685720-dtrace2.txt 2718685720-dtrace2.txt added
Here's another dtrace from HS# 2718685720.
I'm not sure if this will be helpful or much different than the previous.
User confirmed that the CPU was high and network down during dtrace.
Updated by Kristof Provost about 2 years ago
Okay, that would seem to indicate that we're not spending our CPU time in the ena driver. That's a bit unexpected, given the problem description, but that's what dtrace is showing us. Let's see if we can figure out where we are spending our time:
#!/usr/sbin/dtrace -s

profile:::tick-1sec
{
    exit(0);
}

profile:::profile-199
{
    @traces[stack()] = count();
}
dtrace:::END
{
    printf("Done tracing\n");
}
Again, to be run while we're seeing the high CPU load and loss of network connectivity.
Updated by Craig Coonrad about 2 years ago
Update from the user who provided us the dtrace outputs (HS# 2718685720)
Hi, just an update. I changed EC2 type from t3 to m6i and looks like it fixed the issue. I don't see any freezing instances for almost a week. So looks like the issue is triggered by some events on t instances on aws side
We should confirm instance type for anyone encountering this.
 Updated by Chris Linstruth about 2 years ago
Another user is seeing similar behavior on an m5.xlarge with 24.03.
Main symptom there is pfSense static routes defined to the DHCP gateway on ena1 are disappearing until manual intervention replaces them.
OS-Message Buffer.txt:ena1: Found a Tx that wasn't completed on time, qid 0, index 412. 1 msecs have passed since last cleanup. Missing Tx timeout value 5000 msecs.
OS-Message Buffer.txt:ena1: Found a Tx that wasn't completed on time, qid 0, index 271. 1 msecs have passed since last cleanup. Missing Tx timeout value 5000 msecs.
OS-Message Buffer.txt:ena1: Found a Tx that wasn't completed on time, qid 0, index 588. 1 msecs have passed since last cleanup. Missing Tx timeout value 5000 msecs.
OS-Message Buffer.txt:ena0: Found a Tx that wasn't completed on time, qid 0, index 461. 1 msecs have passed since last cleanup. Missing Tx timeout value 5000 msecs.
OS-Message Buffer.txt:ena0: Found a Tx that wasn't completed on time, qid 0, index 583. 1 msecs have passed since last cleanup. Missing Tx timeout value 5000 msecs.
OS-Message Buffer.txt:ena0: Found a Tx that wasn't completed on time, qid 0, index 1008. 1 msecs have passed since last cleanup. Missing Tx timeout value 5000 msecs.
OS-Message Buffer.txt:ena0: Found a Tx that wasn't completed on time, qid 0, index 171. 1 msecs have passed since last cleanup. Missing Tx timeout value 5000 msecs.
OS-Message Buffer.txt:ena1: Found a Tx that wasn't completed on time, qid 0, index 497. 1 msecs have passed since last cleanup. Missing Tx timeout value 5000 msecs.
OS-Message Buffer.txt:ena0: Found a Tx that wasn't completed on time, qid 0, index 704. 1 msecs have passed since last cleanup. Missing Tx timeout value 5000 msecs.
OS-Message Buffer.txt:ena1: Found a Tx that wasn't completed on time, qid 0, index 915. 10 msecs have passed since last cleanup. Missing Tx timeout value 5000 msecs.

May 30 15:52:41 AWSINSTANCE kernel: arpresolve: can't allocate llinfo for 172.21.253.1 on ena1
May 30 15:52:41 AWSINSTANCE kernel: arpresolve: can't allocate llinfo for 172.21.253.1 on ena1
May 30 15:52:41 AWSINSTANCE kernel: arpresolve: can't allocate llinfo for 172.21.253.1 on ena1
May 30 15:52:42 AWSINSTANCE php-fpm[74737]: /rc.newwanip: rc.newwanip: Info: starting on ena1.
May 30 15:52:42 AWSINSTANCE php-fpm[74737]: /rc.newwanip: rc.newwanip: on (IP address: 172.21.253.11) (interface: INSIDE_INTERFACE[lan]) (real interface: ena1).

ena0: <ENA adapter> mem 0xc0624000-0xc0627fff,0xc0400000-0xc04fffff,0xc0610000-0xc061ffff at device 5.0 on pci0
ena0: Elastic Network Adapter (ENA)ena v2.7.0
ena0: ena_com_validate_version() [TID:100000]: ENA device version: 0.10
ena0: ena_com_validate_version() [TID:100000]: ENA controller version: 0.0.1 implementation version 1
ena0: Ethernet address: 02:18:58:xx:xx:xx
ena0: [nm] netmap attach
ena0: netmap queues/slots: TX 4/1024, RX 4/1024
ena1: <ENA adapter> mem 0xc0620000-0xc0623fff,0xc0500000-0xc05fffff,0xc0600000-0xc060ffff at device 6.0 on pci0
ena1: ena_com_validate_version() [TID:100000]: ENA device version: 0.10
ena1: ena_com_validate_version() [TID:100000]: ENA controller version: 0.0.1 implementation version 1
ena1: Ethernet address: 02:0e:36:xx:xx:xx
ena1: [nm] netmap attach
ena1: netmap queues/slots: TX 4/1024, RX 4/1024

May 30 16:35:57 AWSINSTANCE syslogd: sendto: No route to host
May 30 16:35:57 AWSINSTANCE syslogd: sendto: No route to host
May 30 16:35:57 AWSINSTANCE syslogd: sendto: No route to host

FreeBSD 15.0-CURRENT #0 plus-RELENG_24_03-n256311-e71f834dd81: Fri Apr 19 00:28:14 UTC 2024
    root@freebsd:/var/jenkins/workspace/pfSense-Plus-snapshots-24_03-main/obj/amd64/Y4MAEJ2R/var/jenkins/workspace/pfSense-Plus-snapshots-24_03-main/sources/FreeBSD-src-plus-RELENG_24_03/amd64.amd64/sys/pfSense amd64
FreeBSD clang version 17.0.6 (https://github.com/llvm/llvm-project.git llvmorg-17.0.6-0-g6009708b4367)
VT(efifb): resolution 800x600
CPU: Intel(R) Xeon(R) Platinum 8259CL CPU @ 2.50GHz (2500.00-MHz K8-class CPU)
  Origin="GenuineIntel"  Id=0x50657  Family=0x6  Model=0x55  Stepping=7
  Features=0x1f83fbff<FPU,VME,DE,PSE,TSC,MSR,PAE,MCE,CX8,APIC,SEP,MTRR,PGE,MCA,CMOV,PAT,PSE36,MMX,FXSR,SSE,SSE2,SS,HTT>
  Features2=0xfffa3203<SSE3,PCLMULQDQ,SSSE3,FMA,CX16,PCID,SSE4.1,SSE4.2,x2APIC,MOVBE,POPCNT,TSCDLT,AESNI,XSAVE,OSXSAVE,AVX,F16C,RDRAND,HV>
  AMD Features=0x2c100800<SYSCALL,NX,Page1GB,RDTSCP,LM>
  AMD Features2=0x121<LAHF,ABM,Prefetch>
  Structured Extended Features=0xd19f47ab<FSGSBASE,TSCADJ,BMI1,AVX2,SMEP,BMI2,ERMS,INVPCID,MPX,AVX512F,AVX512DQ,RDSEED,ADX,SMAP,CLFLUSHOPT,CLWB,AVX512CD,AVX512BW,AVX512VL>
  Structured Extended Features2=0x18<PKU,OSPKE>
  XSAVE Features=0xf<XSAVEOPT,XSAVEC,XINUSE,XSAVES>
  TSC: P-state invariant, performance statistics
Hypervisor: Origin = "KVMKVMKVM"
Updated by Chris Linstruth about 2 years ago
They do not appear to be seeing noticeably-high CPU load.
 Updated by Azamat Khakimyanov about 2 years ago
- File dtraceresult.txt dtraceresult.txt added
Here's dtrace from HS# 2785863048. This is the ticket Chris mentioned: https://redmine.pfsense.org/issues/15196#note-23
Updated by Kristof Provost about 2 years ago
So the log in comment 23 has "kernel: arpresolve: can't allocate llinfo for 172.21.253.1 on ena1". So I'm wondering if that, combined with the lack of excessive CPU use means we're looking at a two distinct problems here.
The dtrace log in comment 25 doesn't seem to be showing ena malfunction either, but that's consistent with the previous traces we've seen.
We may or may not get anything out of
dtrace -n 'fbt::in_lltable_alloc:return { printf("%x => %x\n", arg0, arg1); }'
for the arpresolve error.
Updated by Georgiy Tyutyunnik about 2 years ago
fresh dtrace didn't produce meaningful results.
asked client to work with affected firewall instead of restoring it by resaving static routes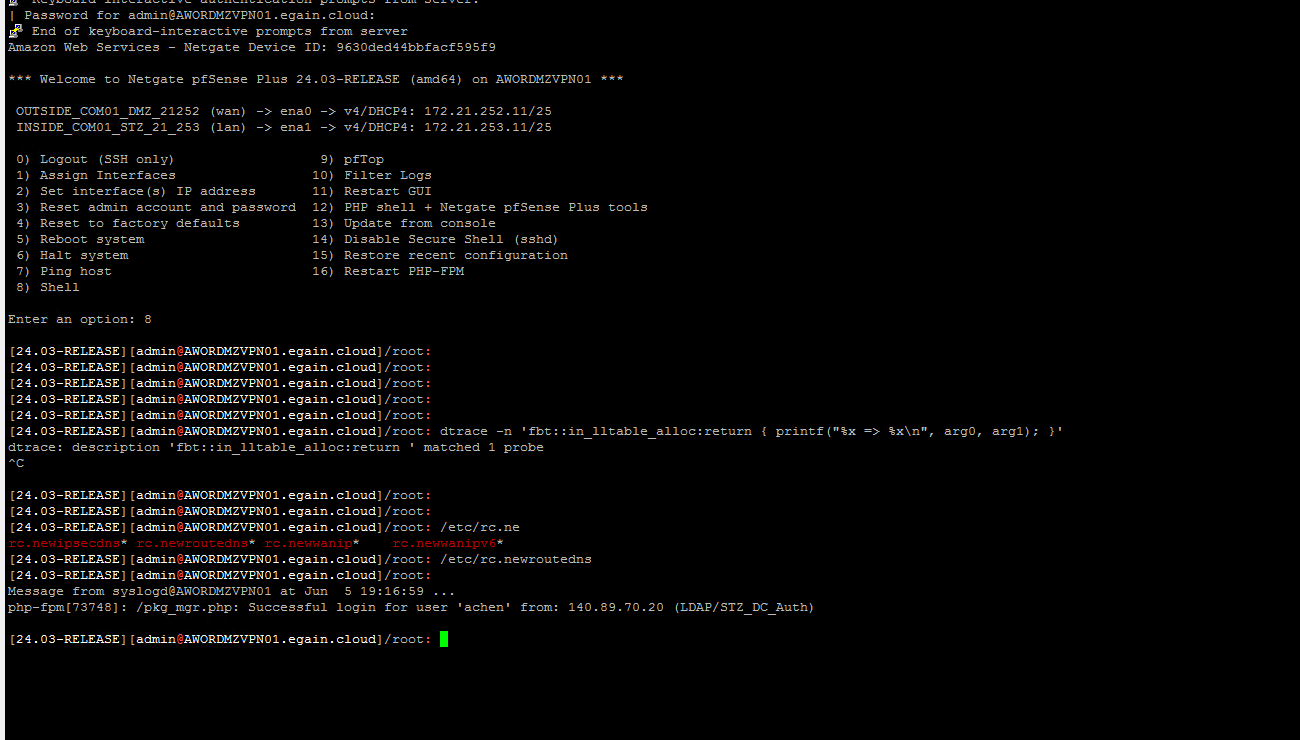
Updated by Chris W about 2 years ago
A fresh deployment of 24.03 on a t3.small. HS# 2828658261. No unusual CPU load.
Jun 12 09:46:43 mrc-fw01 kernel: CPU: Intel(R) Xeon(R) Platinum 8259CL CPU @ 2.50GHz (2500.00-MHz K8-class CPU)

Jun 12 09:46:43 mrc-fw01 kernel: ena0: <ENA adapter> mem 0x80408000-0x8040bfff at device 5.0 on pci0
Jun 12 09:46:43 mrc-fw01 kernel: ena0: Elastic Network Adapter (ENA)ena v2.7.0
Jun 12 09:46:43 mrc-fw01 kernel: ena0: Unable to allocate LLQ bar resource. LLQ mode won't be used.
Jun 12 09:46:43 mrc-fw01 kernel: ena0: ena_com_validate_version() [TID:100000]: ENA device version: 0.10
Jun 12 09:46:43 mrc-fw01 kernel: ena0: ena_com_validate_version() [TID:100000]: ENA controller version: 0.0.1 implementation version 1
Jun 12 09:46:43 mrc-fw01 kernel: ena0: LLQ is not supported. Fallback to host mode policy.
Jun 12 09:46:43 mrc-fw01 kernel: ena0: Ethernet address: 02:fa:bb:xx:xx:xx
Jun 12 09:46:43 mrc-fw01 kernel: ena0: [nm] netmap attach
Jun 12 09:46:43 mrc-fw01 kernel: ena0: netmap queues/slots: TX 2/1024, RX 2/1024

Jun 12 09:46:43 mrc-fw01 kernel: ena1: <ENA adapter> mem 0x80404000-0x80407fff at device 6.0 on pci0
Jun 12 09:46:43 mrc-fw01 kernel: ena1: Unable to allocate LLQ bar resource. LLQ mode won't be used.
Jun 12 09:46:43 mrc-fw01 kernel: ena1: ena_com_validate_version() [TID:100000]: ENA device version: 0.10
Jun 12 09:46:43 mrc-fw01 kernel: ena1: ena_com_validate_version() [TID:100000]: ENA controller version: 0.0.1 implementation version 1
Jun 12 09:46:43 mrc-fw01 kernel: ena1: LLQ is not supported. Fallback to host mode policy.
Jun 12 09:46:43 mrc-fw01 kernel: ena1: Ethernet address: 02:3e:72:xx:xx:xx
Jun 12 09:46:43 mrc-fw01 kernel: ena1: [nm] netmap attach
Jun 12 09:46:43 mrc-fw01 kernel: ena1: netmap queues/slots: TX 2/1024, RX 2/1024

Jun 12 09:46:43 mrc-fw01 kernel: ena2: <ENA adapter> mem 0x80400000-0x80403fff at device 7.0 on pci0
Jun 12 09:46:43 mrc-fw01 kernel: ena2: Unable to allocate LLQ bar resource. LLQ mode won't be used.
Jun 12 09:46:43 mrc-fw01 kernel: ena2: ena_com_validate_version() [TID:100000]: ENA device version: 0.10
Jun 12 09:46:43 mrc-fw01 kernel: ena2: ena_com_validate_version() [TID:100000]: ENA controller version: 0.0.1 implementation version 1
Jun 12 09:46:43 mrc-fw01 kernel: ena2: LLQ is not supported. Fallback to host mode policy.
Jun 12 09:46:43 mrc-fw01 kernel: ena2: Ethernet address: 02:c0:6d:xx:xx:xx
Jun 12 09:46:43 mrc-fw01 kernel: ena2: [nm] netmap attach
Jun 12 09:46:43 mrc-fw01 kernel: ena2: netmap queues/slots: TX 2/1024, RX 2/1024
Updated by Kristof Provost about 2 years ago
Was there a `kernel: arpresolve: can't allocate llinfo ` in HS# 2828658261?
What sort of connection issues is it seeing? Total loss of connectivity or random packet loss? If the latter, how bad is it (i.e. what percentage of packets are getting lost?). Is the connection loss to specific hosts or seemingly random?
What causes us to think this is related to either of the issues discussed in this bug so far, other than "It's on AWS"?
 Updated by Christopher Cope about 2 years ago
Kristof Provost wrote in #note-29:
Was there a `kernel: arpresolve: can't allocate llinfo ` in HS# 2828658261?
What sort of connection issues is it seeing? Total loss of connectivity or random packet loss? If the latter, how bad is it (i.e. what percentage of packets are getting lost?). Is the connection loss to specific hosts or seemingly random?What causes us to think this is related to either of the issues discussed in this bug so far, other than "It's on AWS"?
There was:
Jun 12 04:26:52 mrc-fw01 kernel: arpresolve: can't allocate llinfo for 10.44.2.1 on ena1
Jun 12 04:26:53 mrc-fw01 check_reload_status[458]: rc.newwanip starting ena1
Jun 12 04:26:54 mrc-fw01 php-fpm[640]: /rc.newwanip: rc.newwanip: Info: starting on ena1.
Jun 12 04:26:54 mrc-fw01 php-fpm[640]: /rc.newwanip: rc.newwanip: on (IP address: 10.44.2.254) (interface: LAN[lan]) (real interface: ena1).
It's a loss of connectivity to the "internal devices", which lines up with the above error of the arpresolve error in the LAN interface. They mention no issues connecting to the WebGUI or SSH during the issues via WAN.
The arpresolve error and connection loss on AWS seems similar to the other reports, but it could very well be a separate issue, as the error logs don't line up completely. Potentially related at least.
Updated by Kristof Provost about 2 years ago
Are the users affected by `kernel: arpresolve: can't allocate llinfo` running a routing daemon (openbgpd, frr, ...)?
There's also a possibility that this is 'just' a symptom of misconfiguration where we try to arp-resolve something that's not directly connected. There are ancient forum posts mentioning this error message and that as a cause (even if it's not immediately obvious to me how to provoke such a thing).
Updated by Christopher Cope about 2 years ago
Kristof Provost wrote in #note-31:
Are the users affected by `kernel: arpresolve: can't allocate llinfo` running a routing daemon (openbgpd, frr, ...)?
There's also a possibility that this is 'just' a symptom of misconfiguration where we try to arp-resolve something that's not directly connected. There are ancient forum posts mentioning this error message and that as a cause (even if it's not immediately obvious to me how to provoke such a thing).
This last one has openbgp, but the one before from comment 23 does not.
Updated by Kristof Provost about 2 years ago
`can't allocate llinfo` is logged by arpresolve_full(), when lltable_alloc_entry() returns NULL. lltable_alloc_entry() calls in_lltable_alloc(), which has two scenarios in which it can return NULL, but one of them would log 'lla_lookup: new lle malloc failed". We don't see that (and it would only happen if we're out of memory anyway) so we can assume the other case must be what's happening here.
That other case is in_lltable_rtcheck() failing, which can have multiple reasons, and doesn't easily let us work out which one.
When this recurs (that is, there's a `can't allocate llinfo` error message and no unexpected CPU usage) we should gather at least the routing table information (`netstat -rn`), the ifconfig information (`ifconfig -v`) and the kernel dmesg output. Specifically, I want to know if there are specific routes that could be affecting the in_lltable_rtcheck() result.
Updated by Craig Coonrad about 2 years ago
dtrace submitted based on: https://redmine.pfsense.org/issues/15196#note-21
HS# 2755313440
[23.09.1-RELEASE][admin@az-prd-pfsense.uksouth.cloudapp.azure.com]/usr/local/sbin: cat dtrace_output.txt.2024.06.16-22.00.00
CPU     ID                    FUNCTION:NAME
  0  81750                       :tick-1sec
  1      2                             :END Done tracing

              kernel`esp_output+0x64f
              kernel`tcp_usr_shutdown+0x7e
              kernel`soshutdown+0x11b
              kernel`kern_shutdown+0x5c
              kernel`amd64_syscall+0x109
              kernel`0xffffffff8127250b
                1

              kernel`spinlock_exit+0x2f
              kernel`tcp_do_segment+0x26d7
              kernel`tcp_input_with_port+0x1053
              kernel`tcp_input+0xb
              kernel`ip_input+0x26b
              kernel`swi_net+0x128
              kernel`ithread_loop+0x257
              kernel`fork_exit+0x7f
              kernel`0xffffffff81272c5e
                1

                5

              kernel`acpi_cpu_c1+0x6
              kernel`fork_exit+0x7f
              kernel`0xffffffff81272c5e
              390
Updated by Kristof Provost about 2 years ago
Craig Coonrad wrote in #note-34:
dtrace submitted based on: https://redmine.pfsense.org/issues/15196#note-21
HS# 2755313440[...]
Was this machine showing high CPU load at the time? Because that dtrace output looks like a mostly idle system.
Updated by Craig Coonrad about 2 years ago
Re: https://redmine.pfsense.org/issues/15196#note-35
User has a script in place that kicks off a reboot when the device hits 185 threads. His baseline is 160-165. So CPU should be elevated when this dtrace occured. Though not as high as if the reboot script didn't intervene. (He also mentioned this occurs around 11pm. Which indicates something could be happening in AWS at the time that is related?)
Yes the server tends to run at 160-165 Threads, The reboot script is initiates reboot if thread count is > 185. The tolerance is probably a bit close, but unfortunately we cant risk further issues with our customers connecting to our systems, which I why i have configured it like this. When we have experienced this issue the thread count goes above 200 and we start to have traffic throughput effected. The dtrace i sent occurred at around 11pm, which aligns with the time when we have seen issues in the past, therefore I thought this would be a good example.
Updated by Kristof Provost about 2 years ago
Okay, so the issue is believed to be associated with an increase in thread count. That's new information. It would be useful to know what the extra threads are.
Let's take a `ps -Hauxf` on a normal running system and one on an affected system (or failing that at least by the reboot script just prior to the reboot).
Unless I'm misunderstanding the customer's message they took the dtrace sample on a normal system, so the trace in comment 34 is entirely useless.
Updated by Craig Coonrad about 2 years ago
Re: comment #38, I requested a before and after `ps -Hauxf` from the user.
Another case came in HS# 2879061611. Noticed that like HS# 2755313440 mentioned. The problem kicks in at night around 11pm.
 Updated by Marcos Cosac about 2 years ago
Good morning everyone,
To assist with resolving the issue, I would like to inform you that, after updating the instance, the problem has not recurred. We are now in the third month without any incidents. On the day of the incident, we were using the t3.medium instance. Later, we migrated to the c5.large instance, but this did not solve the problem. The solution only came when we started using the m6i.large instance, which is the one we are still using today.
Updated by Jim Thompson over 1 year ago
T2.medium is 2C haswell/broadwell and non-ENA
T3.medium is 2C skylake/canyon lake but has ENA
both get 24 CPU credits/hour,so if they get busy, they get rescheduled
C5.large is 2C skylake/canyon lake, and (like T3) has Nitro, and therefore ENA
m6i.large is 2C ice lake (and also has Nitro)
I've spoken with Mateusz and we're going to try to create a 2.8.0 (updated last week) variant of the ENA driver.
https://cgit.freebsd.org/src/commit/sys/dev/ena?id=ce4cc746bb4171a131ab9099947a500c0de18ff4
ena: Update driver version to v2.8.0
Features:
* Add support for device request reset message over AENQ
* Support LLQ entry size recommendation from device
* Support max large LLQ depth from the device
* Expand PHC infrastructures
* Configuration notification support

Bug Fixes:
* Fix leaking ifmedia resources on detach
* Fix netmap socket chain unmapping issue
* Properly reinit netmap structs upon sysctl changes
* Correctly count missing TX completions

Minor Changes:
* Add reset reason for corrupted TX/RX completion descriptors
* Add reset reason for missing admin interrupts
* Improve reset reason statistics
* Update licenses

Approved by: cperciva (mentor)
MFC after: 2 weeks
Sponsored by: Amazon, Inc.
 Updated by Mateusz Guzik over 1 year ago
The customer agreed to test the newer version of the driver. I created a version for 24.03 specifically for them to do it, other people are going to handle shipping it.
After talking to Colin Percival I found the "Missing Tx timeout" thing is a known problem and it remains unfixed by the newer version of the driver. However, it has other fixes and it very well may be the traffic will keep flowing despite the above, so the aforementioned testing is still more than warranted.
As for what's going on with the timeout thing: I suspect it's a scheduling starvation problem.
One of the comments above claims occurrences are correlated with high CPU usage, additionally Colin confirms the issue is load-related. On top of that the instances are only 2 vCPU or so.
I know for a fact the FreeBSD kernel can starve threads in 2 ways:
1. [note "higher" priority means less important] the scheduler can indefinitely fail to put a higher thread on CPU if there is a constant stream of lower priority threads -- it always picks the lowest available
2. there are spots (notably including pf!) which disable preemption without a guarantee they will re-enable it in a finite time. in case of pf this means a high enough load can keep the CPU occupied while actively preventing any other threads from getting CPU time. This is not a hypothetical -- for example some time ago we rebooted a pfSense instance which was under load generation from trex and the box was unable to finish booting as the pf rules lock was indefinitely held for reading, while it was needed for writing to change the config. This lasted for several seconds before we killed the load generator.
If an instance is running a fast enough vCPU there may be enough of a time window between packets that preemption is re-enabled and the issue does not manifest itself, this in turn would explain why Ice Lake (quite a new uarch) does not suffer the problem while old yellers like Haswell do.
Where this is what's at fault here is impossible to say as is. I'm going to implement some diagnostics to detect the problem in general.
As for addressing the above 2 points, I have some ideas but I'm going to have to chew on it. So far we don't know if this is the thing yet.
 Updated by Jim Pingle over 1 year ago
- Status changed from Confirmed to Not a Bug
- Affected Plus Version deleted (
23.09.1)
This is not a bug and presents regardless of OS. It's part of the behavior of T3 instance sizes. If an instance exceeds the allowed baseline CPU for its size and exhausts its CPU credits, AWS clamps the instance CPU back down to the baseline no matter what the load is. AWS limiting the CPU while under load results in these problems/errors. The OS can't do anything here. If it happens regularly the instance is undersized for its actual load and should be migrated to a larger instance size or different type.
There is now a warning to this effect in the documentation:
https://docs.netgate.com/pfsense/en/latest/solutions/aws-vpn-appliance/instance-type-and-sizing.html